Fig. 4.

Download original image
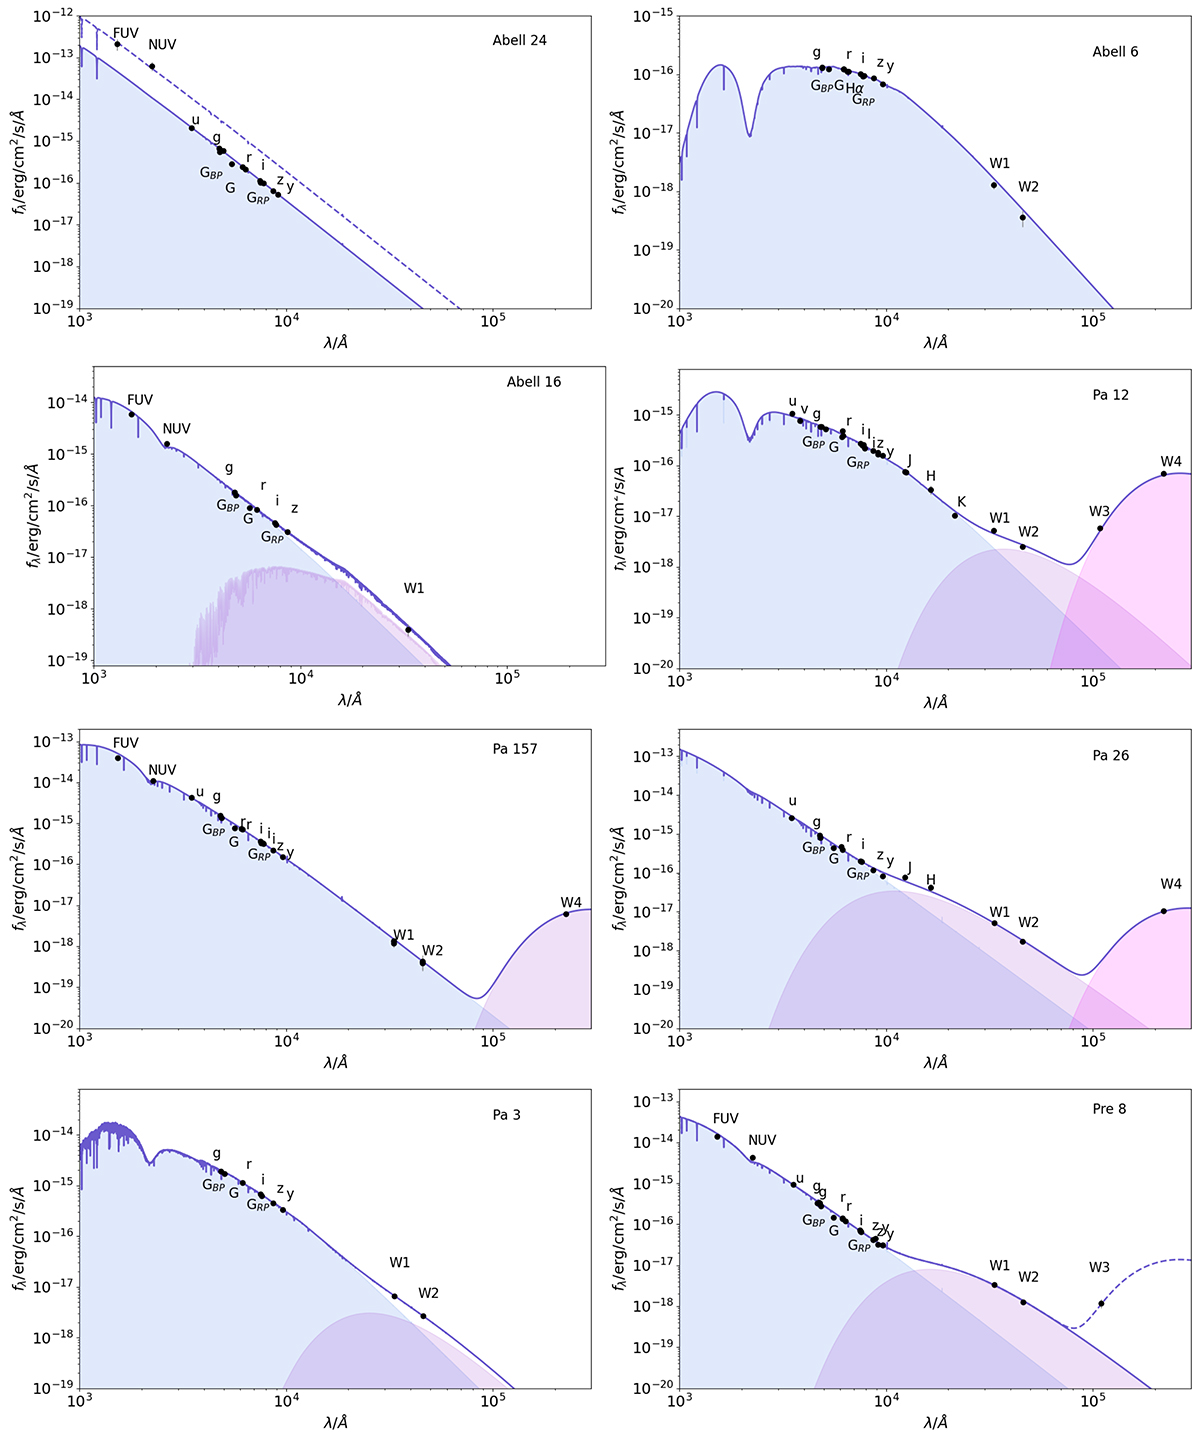
Spectral energy distribution fits for eight central stars. Top row: Two examples of SED fits for stars that do not show an IR excess. Remaining spectra: Multicomponent SED fits for the stars in our sample that show a near- and/or far-infrared excess. Black dots correspond to observed photometry; the blue and purple shaded areas correspond to the flux contribution of the CS and a cool blackbody, respectively; and the dark purple line is the (combined) best fit to the observation.
Current usage metrics show cumulative count of Article Views (full-text article views including HTML views, PDF and ePub downloads, according to the available data) and Abstracts Views on Vision4Press platform.
Data correspond to usage on the plateform after 2015. The current usage metrics is available 48-96 hours after online publication and is updated daily on week days.
Initial download of the metrics may take a while.


