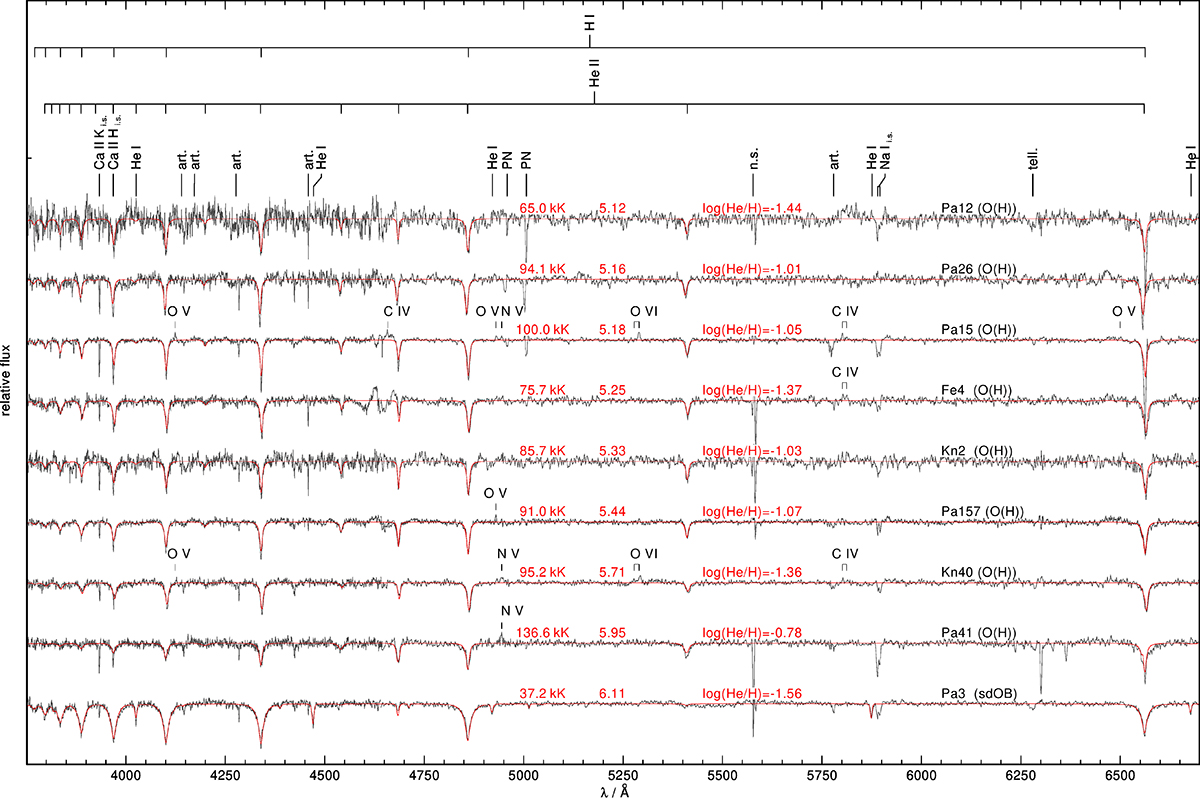
Fig. 1.
Download original image
Model-atmosphere fits (red graphs) to observed spectra (black graphs) of nine of our H-rich central stars. The spectra are sorted by increasing log g from top to bottom. Spectral classifications, names of stars, derived effective temperatures, surface gravities, and logarithmic He/H ratios (by number) are indicated. Identified lines are marked. The PN emission lines are oversubtracted in the top three spectra. Features near 4640 Å are artifacts where the UV and Orange spectral channels are joined. Several apparently sharp features are instrumental artifacts, marked “art.”. Interstellar absorption lines are labeled “i.s.”, telluric absorption is marked “tell.”, and imperfectly subtracted night-sky features are labeled “n.s.”. Oversubtracted nebular lines of [O III] in the top three spectra are marked “PN”.
Current usage metrics show cumulative count of Article Views (full-text article views including HTML views, PDF and ePub downloads, according to the available data) and Abstracts Views on Vision4Press platform.
Data correspond to usage on the plateform after 2015. The current usage metrics is available 48-96 hours after online publication and is updated daily on week days.
Initial download of the metrics may take a while.