Open Access
Fig. 1
Download original image
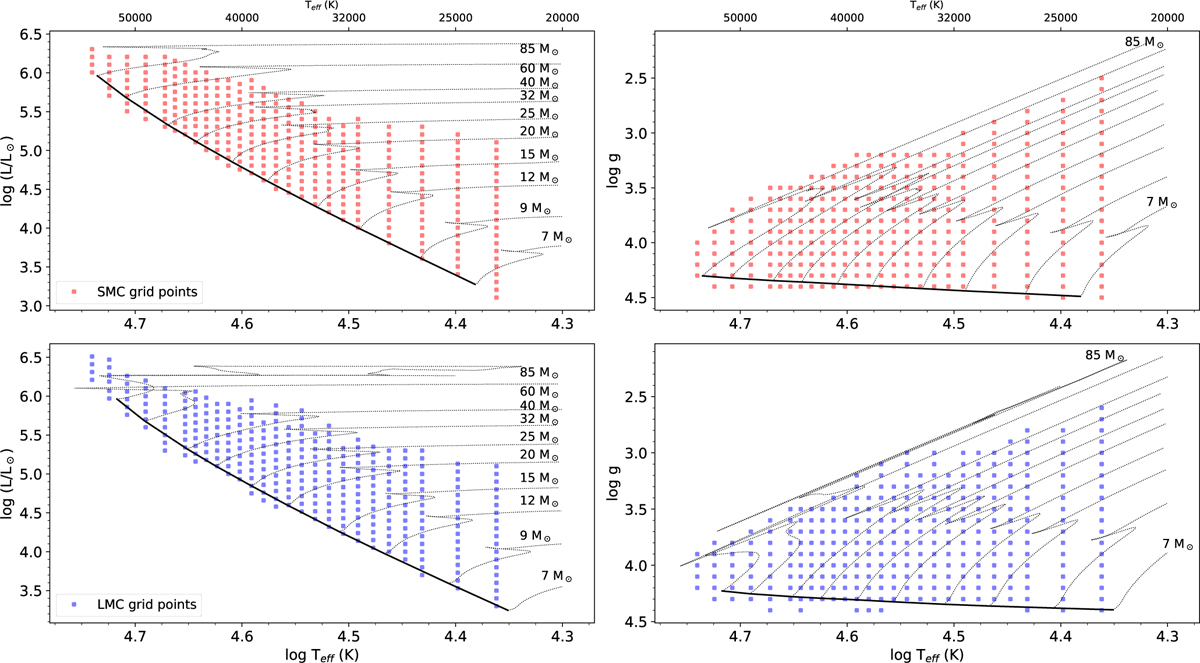
SMC and LMC grid coverage in the Hertzsprung-Russell (left panels) and Kiel diagrams (right panels). Tracks from Georgy et al. (2013) and Eggenberger et al. (2021) are represented by dotted-lines. The thick solid line indicates the location of the ZAMS.
Current usage metrics show cumulative count of Article Views (full-text article views including HTML views, PDF and ePub downloads, according to the available data) and Abstracts Views on Vision4Press platform.
Data correspond to usage on the plateform after 2015. The current usage metrics is available 48-96 hours after online publication and is updated daily on week days.
Initial download of the metrics may take a while.