Fig. 9
Download original image
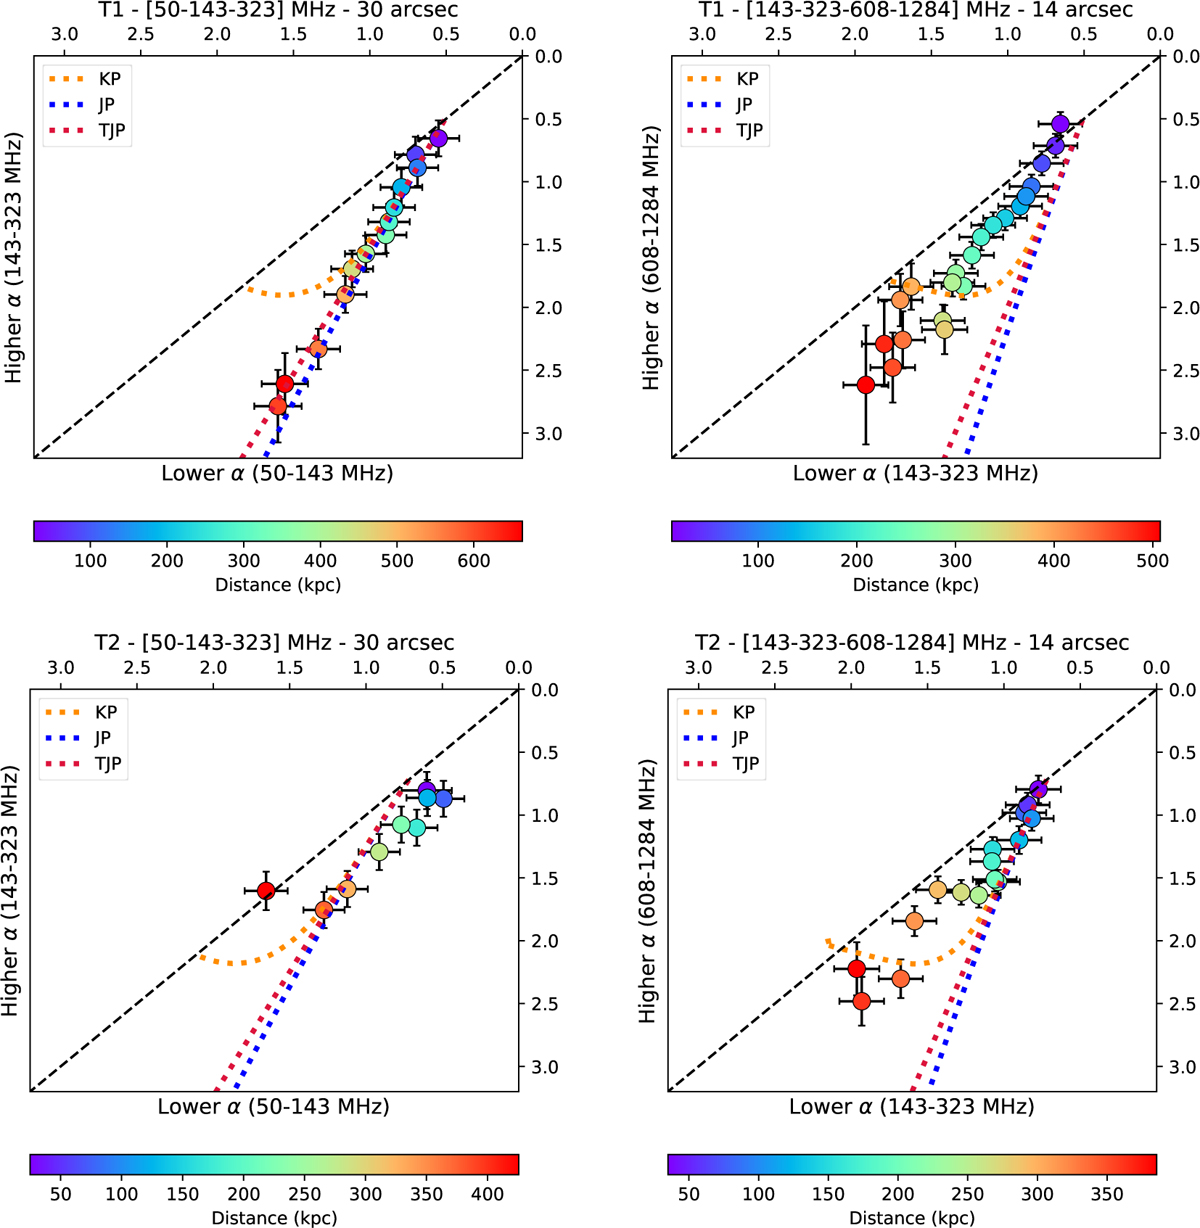
Radio colour-colour diagrams of T1 (top) and T2 (bottom). Data points are colour-coded based on their increasing distance from the core from blueish to reddish colours. The black dashed line (one-to-one line) indicates a power law with α = αinj. The dotted lines represent the theoretical KP (orange), JP (blue), and TJP (red) ageing curves obtained with αinj = 0.51 (T1), αinj = 0.72 (T2), B0 = 2.2 μG (T1, T2) as input. The frequency pairs and resolution are the same as in Fig. 8.
Current usage metrics show cumulative count of Article Views (full-text article views including HTML views, PDF and ePub downloads, according to the available data) and Abstracts Views on Vision4Press platform.
Data correspond to usage on the plateform after 2015. The current usage metrics is available 48-96 hours after online publication and is updated daily on week days.
Initial download of the metrics may take a while.