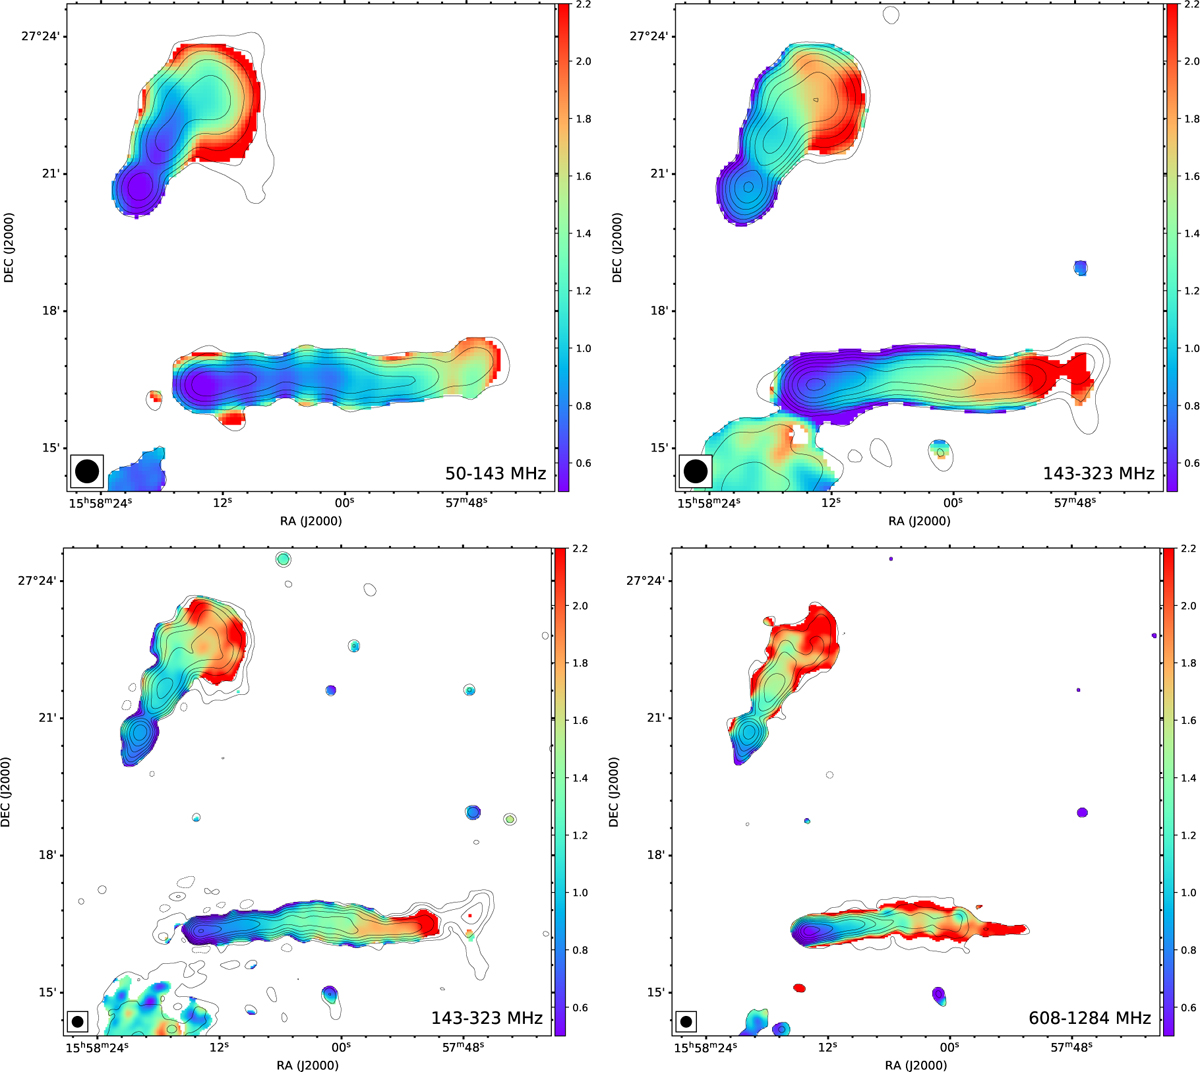
Fig. 7
Download original image
Spectral index maps of T1 and T2 computed with a threshold of S ≥ 5σ. In all the panels, the contour levels are [±5, 10, 20, ...] × σ of the lowest-frequency image in each combination. Top: spectral index maps at 30 between 50–143 MHz (left) and 143–323 MHz (right). Bottom: spectral index maps at 14″ between 143–323 MHz (left) and 608–1284 MHz (right). The corresponding error maps are shown in Fig. A.1.
Current usage metrics show cumulative count of Article Views (full-text article views including HTML views, PDF and ePub downloads, according to the available data) and Abstracts Views on Vision4Press platform.
Data correspond to usage on the plateform after 2015. The current usage metrics is available 48-96 hours after online publication and is updated daily on week days.
Initial download of the metrics may take a while.