Fig. 6
Download original image
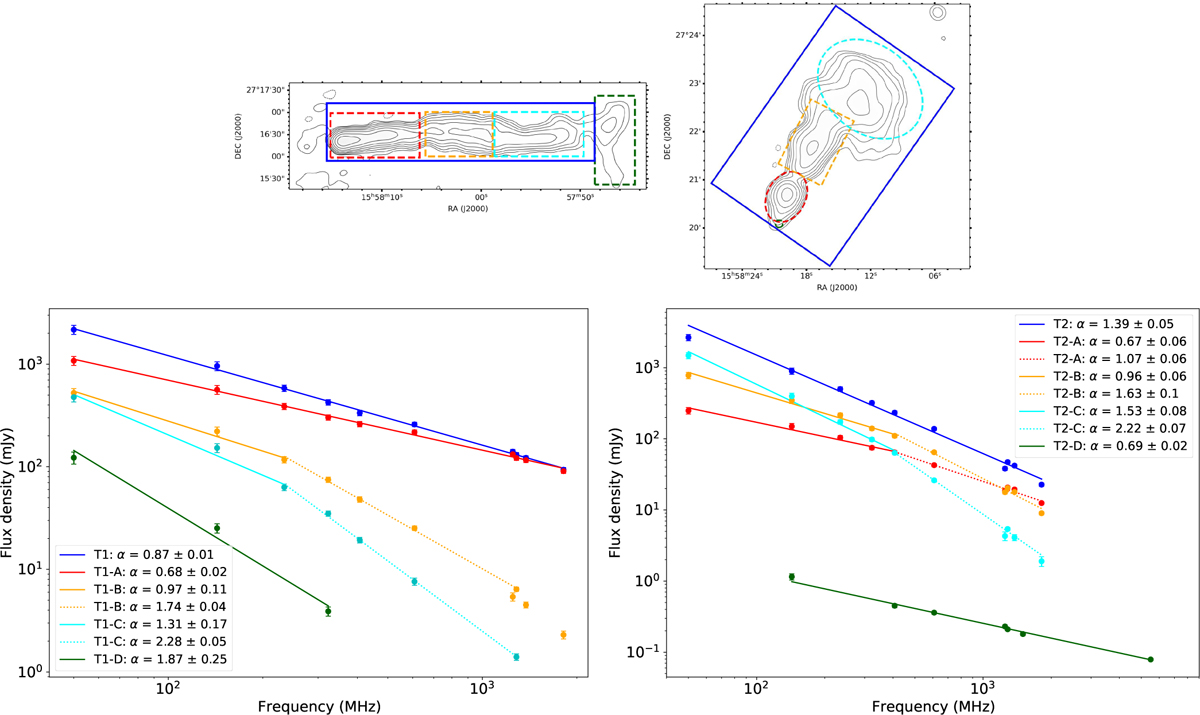
Radio spectra of T1 and T2. Left and right panels refer to T1 and T2, respectively. Data points are the flux densities reported in Table 4, measured from the regions (including the green circle used for the core of T2) shown in the top panels following the same colour-code. Flux densities were fitted with single (solid lines) or double (solid plus dotted lines) power laws (see Table 5).
Current usage metrics show cumulative count of Article Views (full-text article views including HTML views, PDF and ePub downloads, according to the available data) and Abstracts Views on Vision4Press platform.
Data correspond to usage on the plateform after 2015. The current usage metrics is available 48-96 hours after online publication and is updated daily on week days.
Initial download of the metrics may take a while.