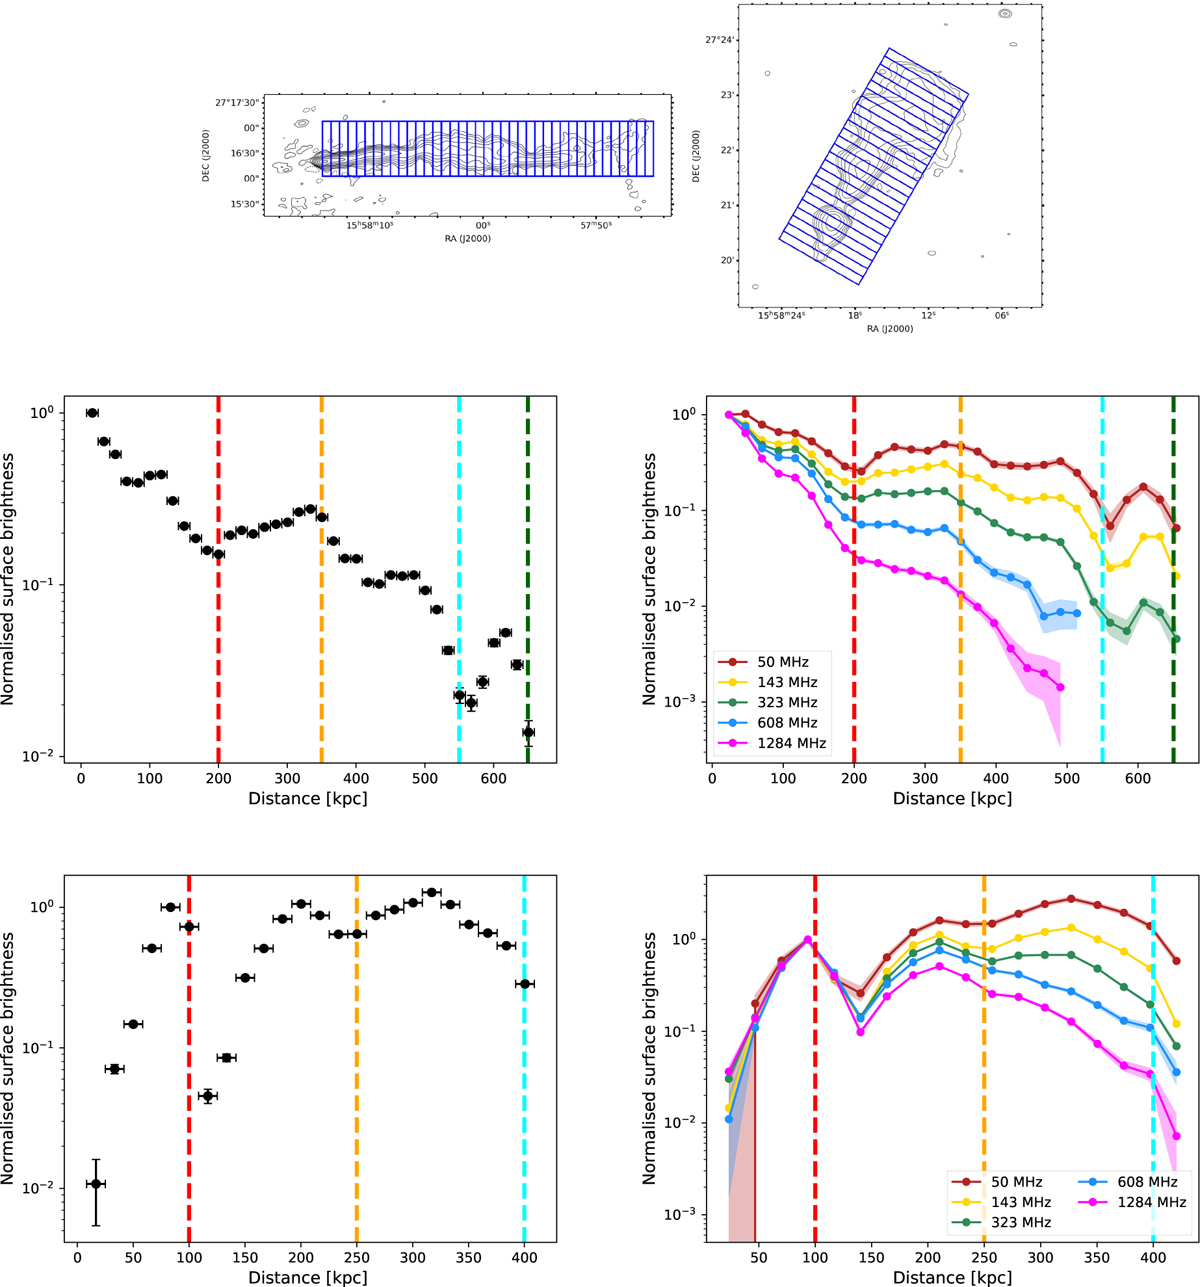
Fig. 5
Download original image
Radio surface brightness profiles of T1 and T2 normalised to the peak value within T1-A and T2-A, respectively. Left panels: profiles of T1 (middle) and T2 (bottom) at 143 MHz (resolution 9″ × 6″). The sampling boxes are shown in the top panels and have a width of 10″. Right panels: comparison of profiles at 50 (brown), 143 (yellow), 323 (green), 608 (light blue), and 1284 (magenta) MHz. The resolution of the images and the width of the sampling boxes (not shown) are 14″. In middle and bottom panels, the vertical lines indicate the boundaries of sub-regions as in Fig. 2.
Current usage metrics show cumulative count of Article Views (full-text article views including HTML views, PDF and ePub downloads, according to the available data) and Abstracts Views on Vision4Press platform.
Data correspond to usage on the plateform after 2015. The current usage metrics is available 48-96 hours after online publication and is updated daily on week days.
Initial download of the metrics may take a while.