Fig. 2
Download original image
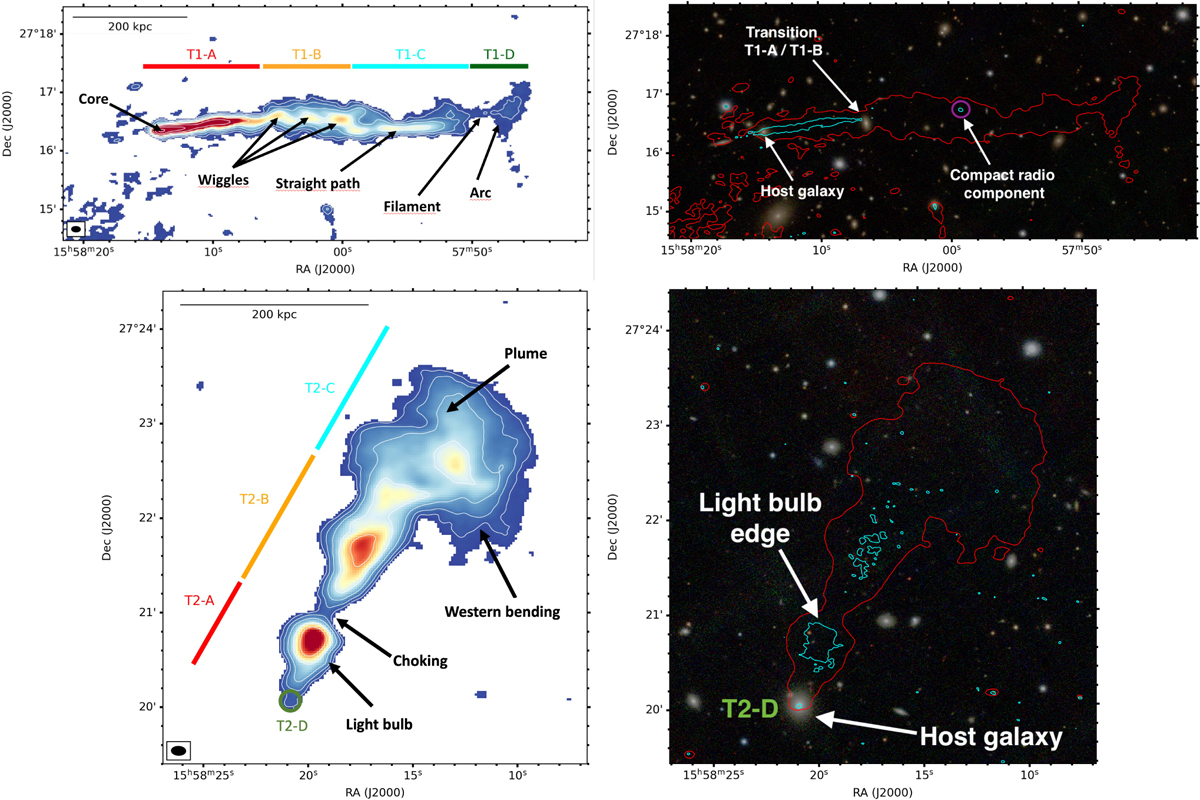
Radio images and contours labelling the sub-regions and features discussed in the text. Left panels: 143 MHz images (see Figs. 3 and 4) of T1 (top) and T2 (bottom). Right panels: Pan-STARSS optical (composite i, r, g filters) images zoomed towards T1 (top) and T2 (bottom). Radio contours at 143 MHz (5σ, in red) and 1250 MHz (5σ for T1 and 3σ for T2, in cyan) are overlaid.
Current usage metrics show cumulative count of Article Views (full-text article views including HTML views, PDF and ePub downloads, according to the available data) and Abstracts Views on Vision4Press platform.
Data correspond to usage on the plateform after 2015. The current usage metrics is available 48-96 hours after online publication and is updated daily on week days.
Initial download of the metrics may take a while.