Fig. B.1
Download original image
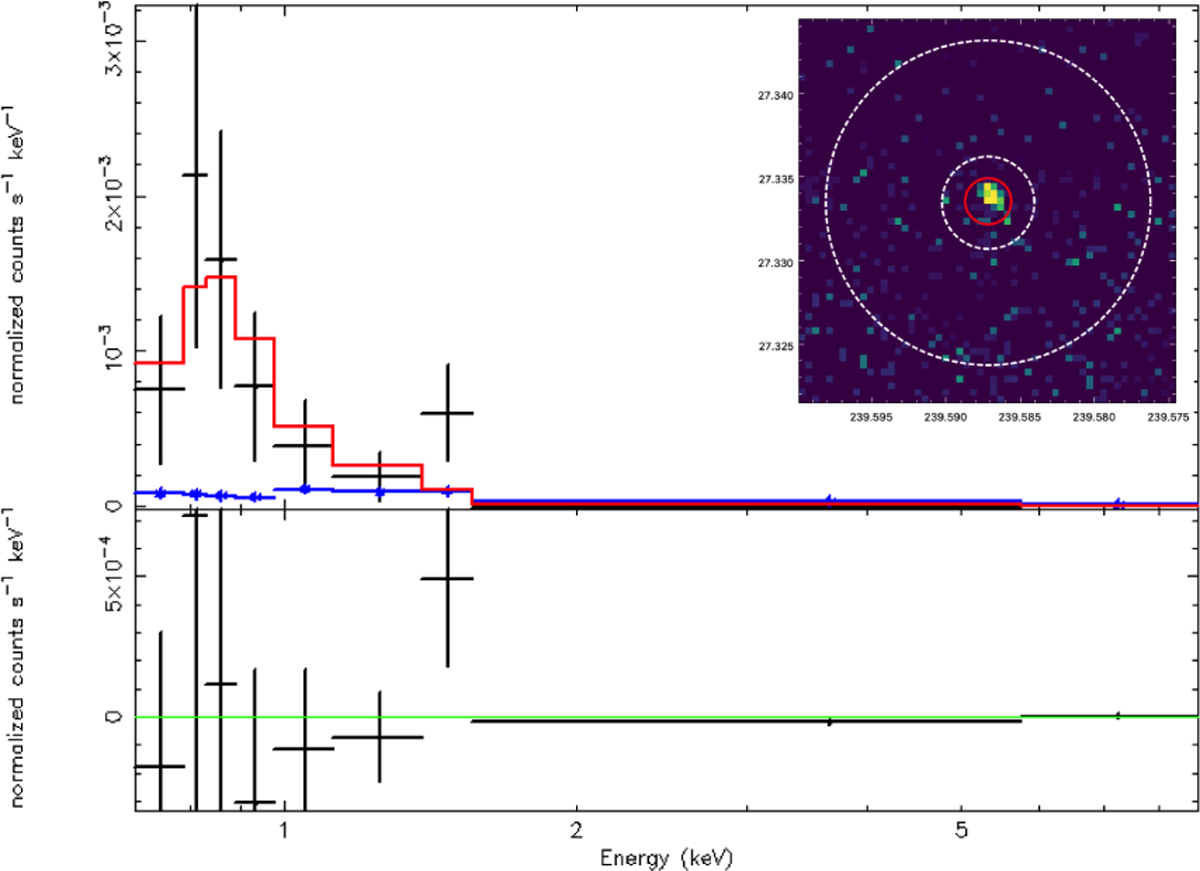
Chandra X-ray spectrum of the host of T2. The upper inset shows the extraction regions used for the source (red circle) and background (with annulus). Spectra were extracted for all available observations and jointly fitted, but a single spectrum is shown for clearer inspection. Data points were fitted with an absorbed thermal component (red curve). The subtracted background is shown in blue. The ratio of the data to the model is reported in the lower inset.
Current usage metrics show cumulative count of Article Views (full-text article views including HTML views, PDF and ePub downloads, according to the available data) and Abstracts Views on Vision4Press platform.
Data correspond to usage on the plateform after 2015. The current usage metrics is available 48-96 hours after online publication and is updated daily on week days.
Initial download of the metrics may take a while.