Fig. 12
Download original image
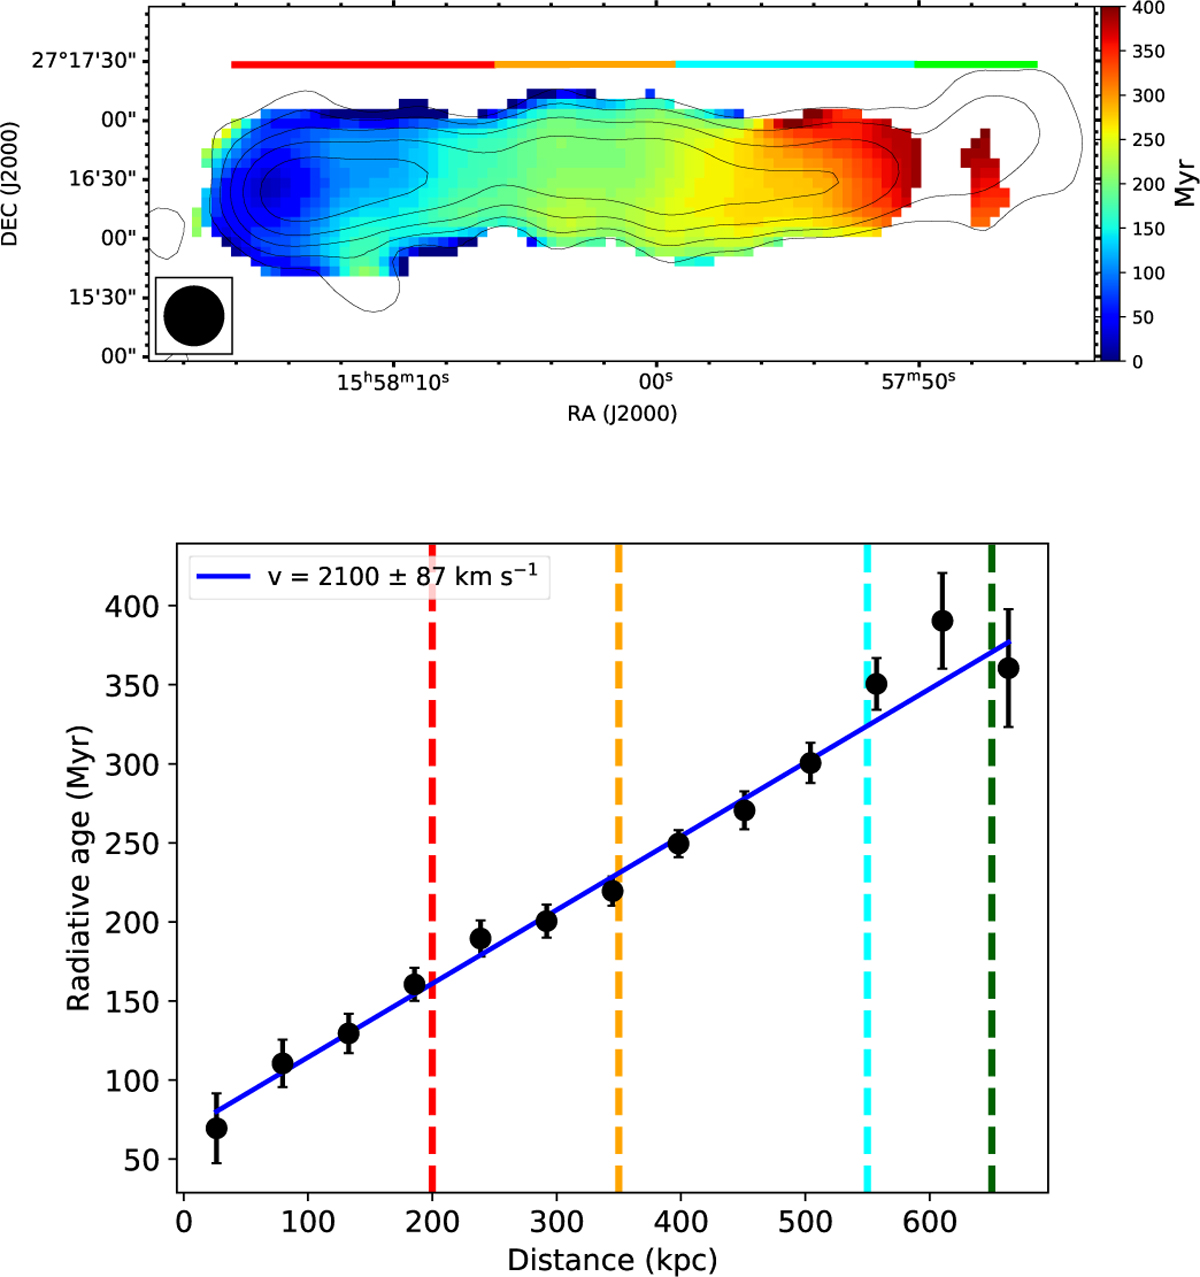
Radiative age of T1. Top: radiative age map at 30″ obtained by fitting radio images at 50, 143, and 323 MHz with the TJP model (αinj = 0.51, B0 = 2.2 μG). Typical errors are ~20 Myr. The sub-regions are indicated by horizontal bars. Bottom: age profile measured in boxes of beam-size width. The boundaries of the sub-regions are indicated with dashed vertical lines. The blue solid line is the result of a linear fit to the data points.
Current usage metrics show cumulative count of Article Views (full-text article views including HTML views, PDF and ePub downloads, according to the available data) and Abstracts Views on Vision4Press platform.
Data correspond to usage on the plateform after 2015. The current usage metrics is available 48-96 hours after online publication and is updated daily on week days.
Initial download of the metrics may take a while.