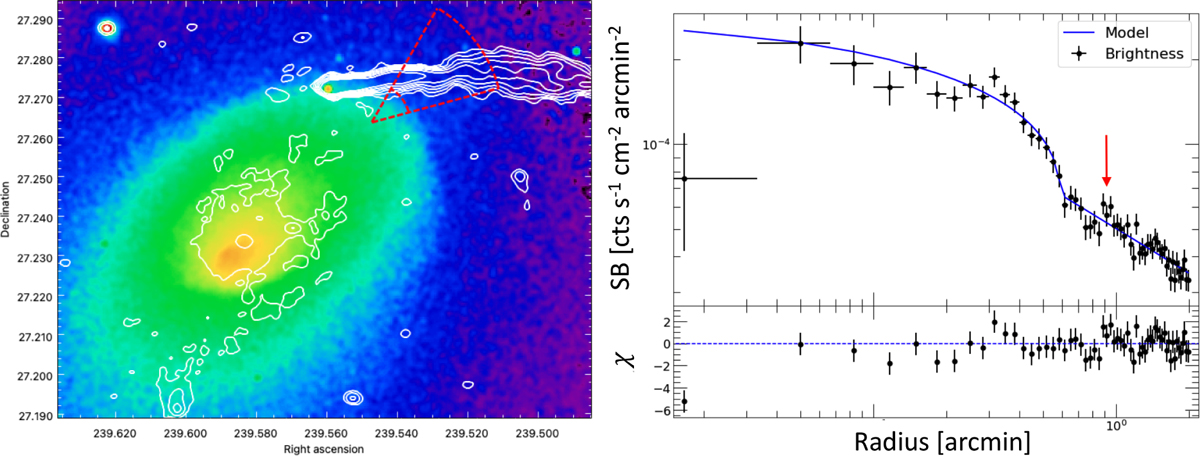
Fig. 11
Download original image
X-ray surface brightness analysis in the direction of T1. Left: Chandra X-ray image in the 0.5–2 keV band with overlaid radio contours. The surface brightness was measured from the red sector in annuli of width 2″. The fitted position of the discontinuity is shown within the sector, and is coincident with the NW cold front. Right: data points fitted with a broken power law (blue line). The red arrow indicates the peak discussed in Sec. 4.6.
Current usage metrics show cumulative count of Article Views (full-text article views including HTML views, PDF and ePub downloads, according to the available data) and Abstracts Views on Vision4Press platform.
Data correspond to usage on the plateform after 2015. The current usage metrics is available 48-96 hours after online publication and is updated daily on week days.
Initial download of the metrics may take a while.