Fig. 10
Download original image
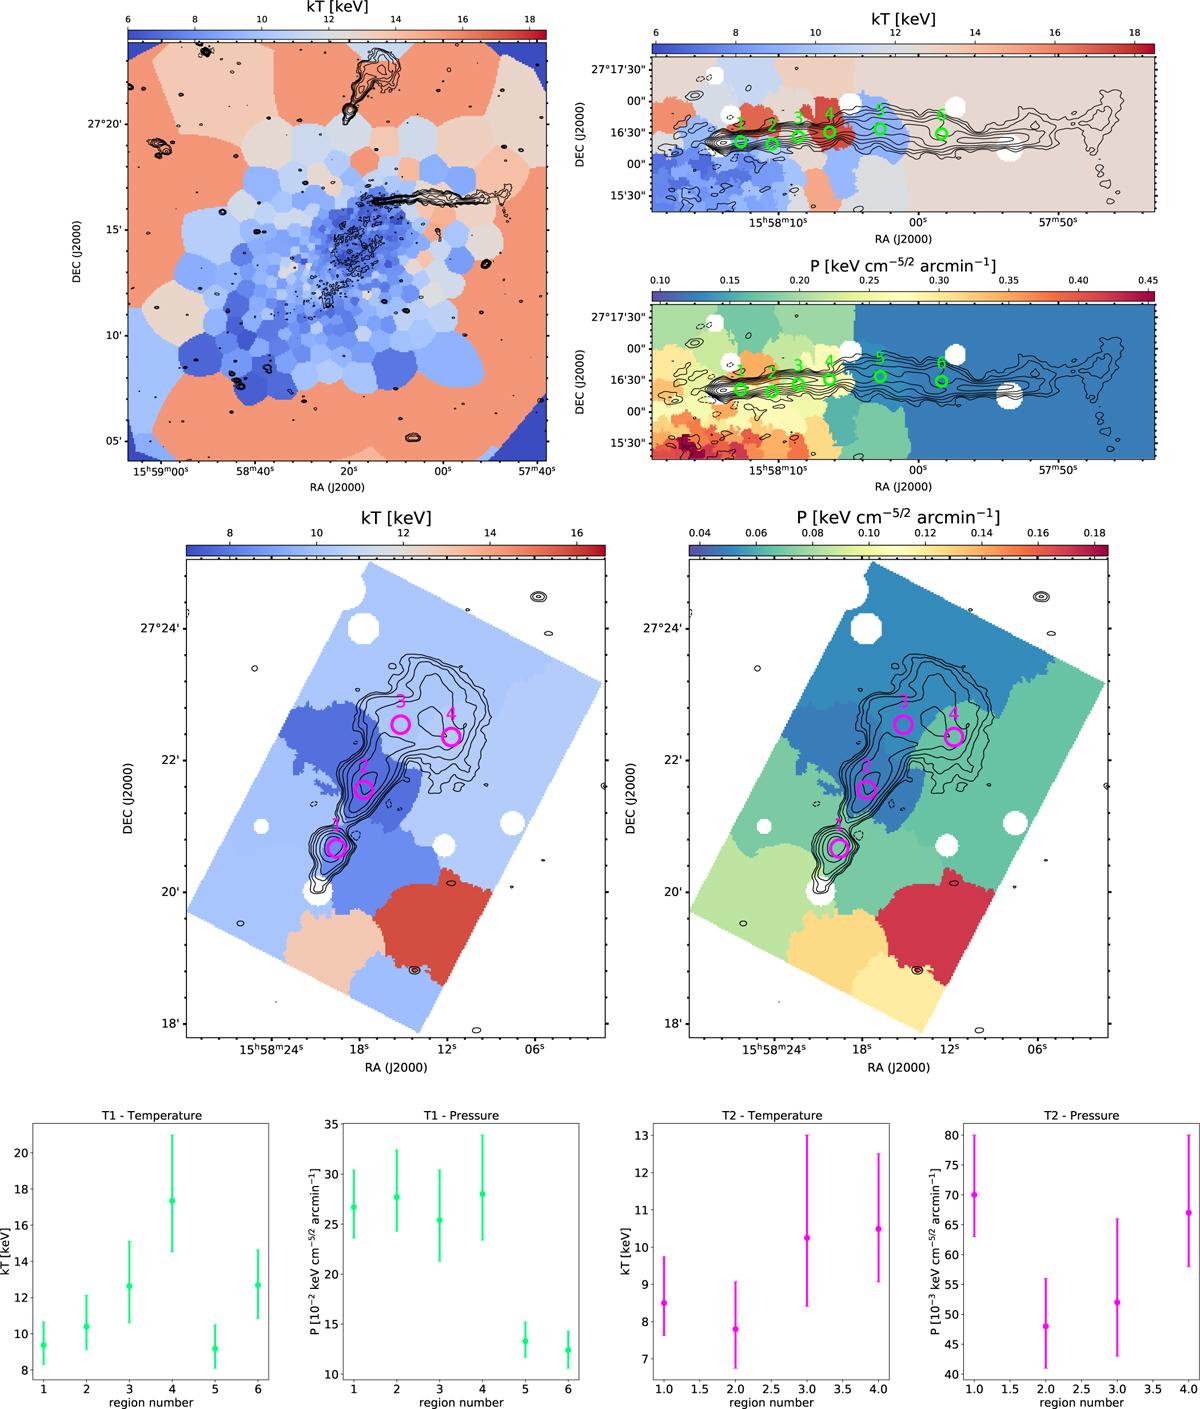
Projected thermodynamic maps. Top left: temperature map from XMM-Newton photometric analysis covering the whole cluster (adapted from Rossetti et al. 2013). Top right: temperature and pressure maps from Chandra spectral analysis towards T1. Bin ‘4’ roughly marks the transition T1-A/T1-B. Middle: temperature and pressure maps from Chandra spectral analysis towards T2. Bin ‘1’ includes T2-A and the choke, bin ‘2’ includes T2-B. Bottom: temperature and pressure profiles for T1 (green) and T2 (magenta), as measured from the bins that are labelled in the corresponding maps with circles. The white dots in the Chandra maps indicate point sources excluded from the analysis. The LOFAR HBA radio contours are overlaid in black.
Current usage metrics show cumulative count of Article Views (full-text article views including HTML views, PDF and ePub downloads, according to the available data) and Abstracts Views on Vision4Press platform.
Data correspond to usage on the plateform after 2015. The current usage metrics is available 48-96 hours after online publication and is updated daily on week days.
Initial download of the metrics may take a while.