Fig. 1
Download original image
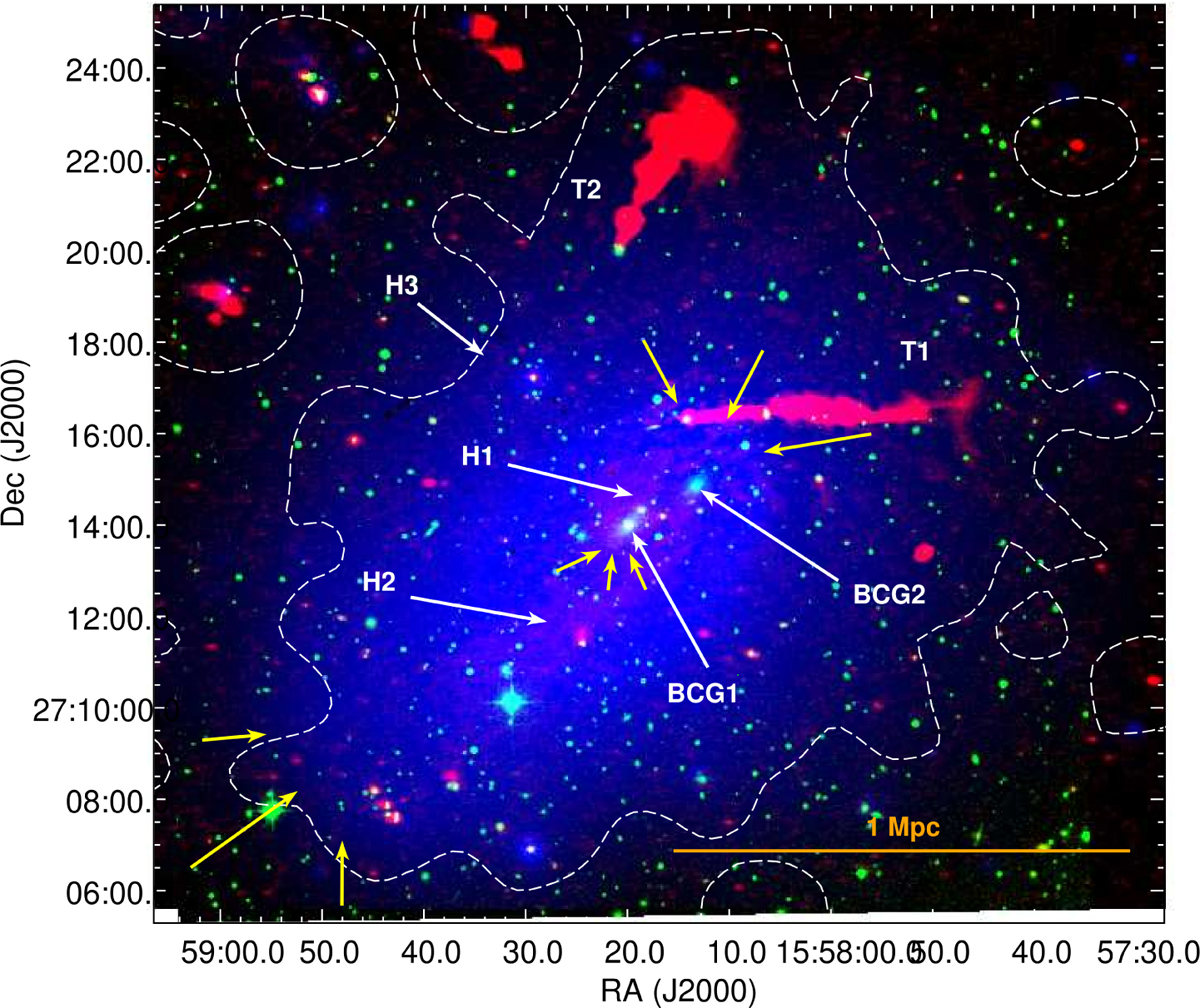
Composite RGB image of A2142: radio (LOFAR at 143 MHz, 9″ × 6″) in red, optical (DSS-2, r-filter) in green, and X-rays (XMM-Newton, 0.7–1.2 keV) in blue. Labels indicate the tailed radio galaxies (T1, T2), the primary and secondary brightest cluster galaxies (BCG1, BCG2), and the two components (H1, H2) of the radio halo. The dashed white contours represent the 3σ level of the 73″ × 66″ LOFAR image at 143 MHz reported in Bruno et al. (2023), showing the third component (H3) of the radio halo. The yellow arrows indicate the location of the NW, central, and SE cold fronts reported by Rossetti et al. (2013).
Current usage metrics show cumulative count of Article Views (full-text article views including HTML views, PDF and ePub downloads, according to the available data) and Abstracts Views on Vision4Press platform.
Data correspond to usage on the plateform after 2015. The current usage metrics is available 48-96 hours after online publication and is updated daily on week days.
Initial download of the metrics may take a while.