Fig. 5
Download original image
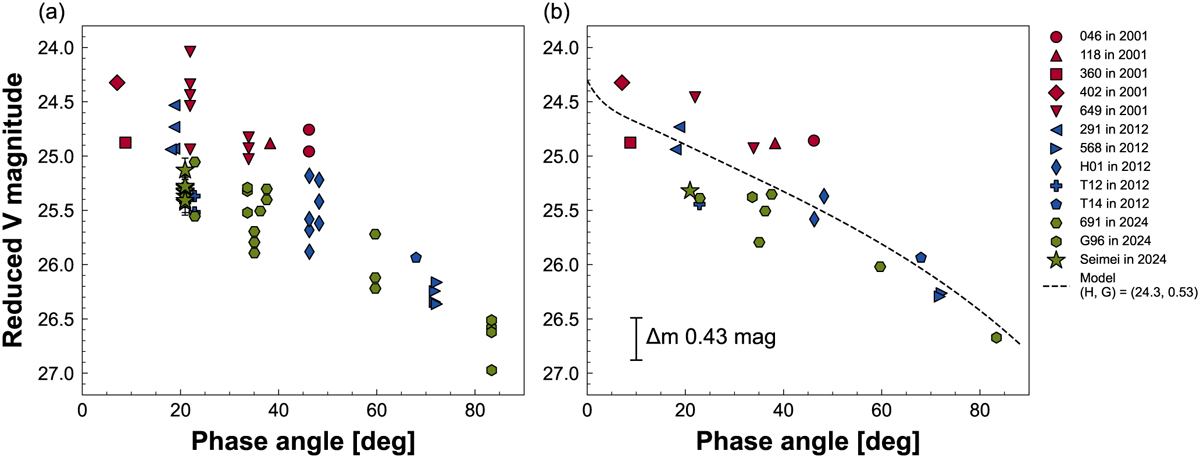
Phase angle dependence of the reduced V magnitudes of 2001 QJ142. Observations from the MPC database are also plotted with different markers depending on the MPC code after magnitude conversions (see the main text for details). Mean reduced V-band magnitudes with Seimei/TriCCS are presented as stars. (a) All magnitudes in the MPC database (except for those without filter information) plotted along with those determined from Seimei/TriCCS data. Bars indicate the 1σ uncertainties. (b) All magnitudes obtained on the same day at the same site, averaged. The fitting model curve with the H-G model is shown as a dashed line. The light curve amplitude with a period of 623.8 s, 0.43 mag, is indicated.
Current usage metrics show cumulative count of Article Views (full-text article views including HTML views, PDF and ePub downloads, according to the available data) and Abstracts Views on Vision4Press platform.
Data correspond to usage on the plateform after 2015. The current usage metrics is available 48-96 hours after online publication and is updated daily on week days.
Initial download of the metrics may take a while.