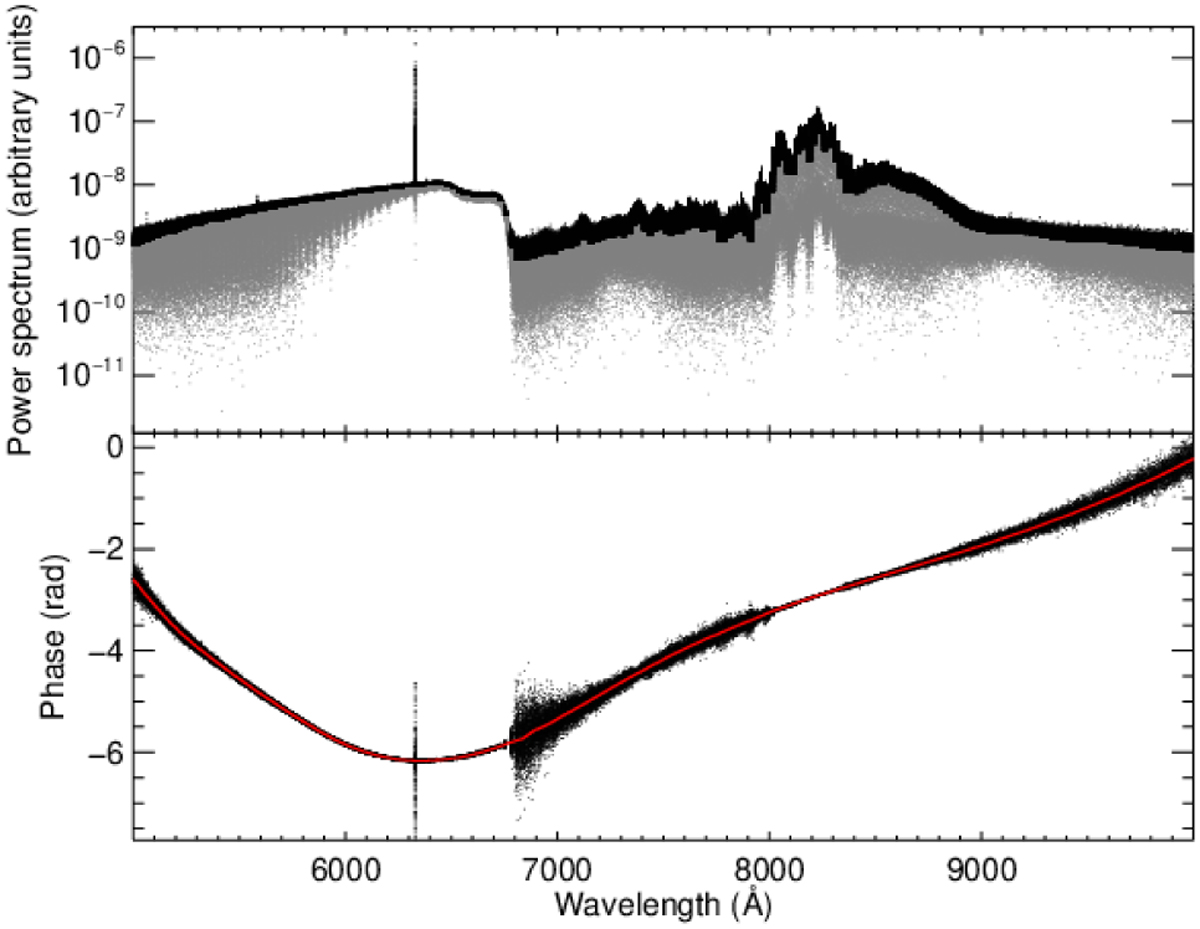
Fig. A.1
Download original image
Top:Power spectrum of the combined iodine and LFC light as in Fig. 1. The top 20 % of the data points are used for phase correction and shown in black. Bottom: Phase reconstructed from the symmetric part of the interferogram following the ’Mertz’ algorithm. The red line shows a spline fit to a running median of the phase data. This smooth curve is used for phase correction.
Current usage metrics show cumulative count of Article Views (full-text article views including HTML views, PDF and ePub downloads, according to the available data) and Abstracts Views on Vision4Press platform.
Data correspond to usage on the plateform after 2015. The current usage metrics is available 48-96 hours after online publication and is updated daily on week days.
Initial download of the metrics may take a while.