Fig. 4
Download original image
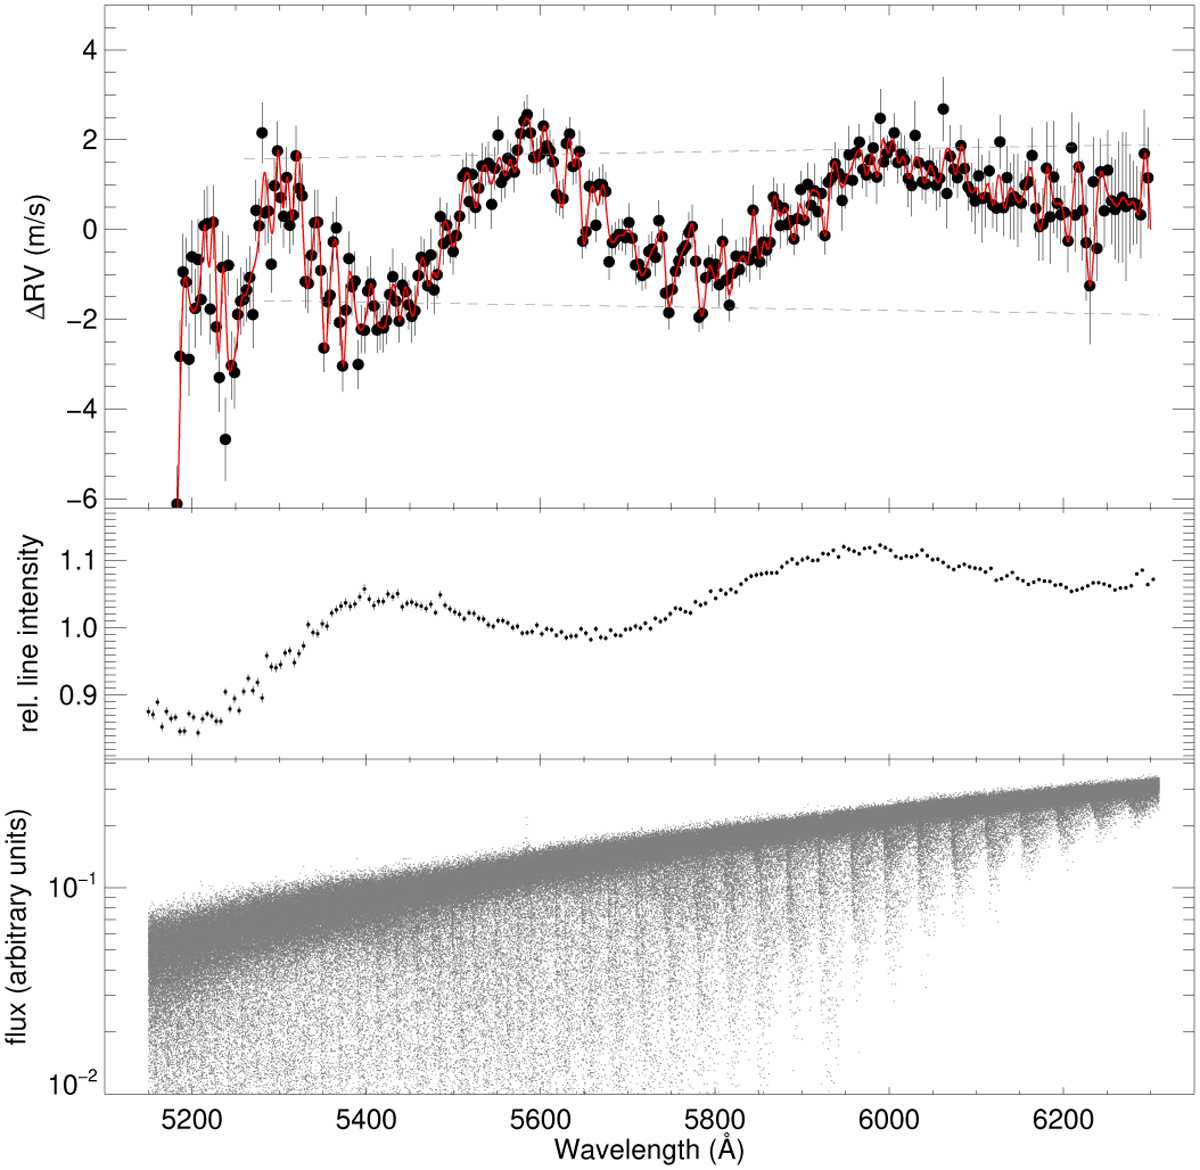
Doppler velocity offset between the I2 model and observations after zero-point correction. Top: individual Doppler offsets in chunks of 200 km s−1 width (black circles). Gray dashed lines show uncertainty limits as estimated in Knöckel et al. (2004). The red line shows a spline fit to the Doppler offsets showing a systematic pattern in the offsets. Middle: relative I2 line intensities as determined from the fitting procedure (see text). Bottom: observed spectrum of I2 for comparison.
Current usage metrics show cumulative count of Article Views (full-text article views including HTML views, PDF and ePub downloads, according to the available data) and Abstracts Views on Vision4Press platform.
Data correspond to usage on the plateform after 2015. The current usage metrics is available 48-96 hours after online publication and is updated daily on week days.
Initial download of the metrics may take a while.