Fig. 3
Download original image
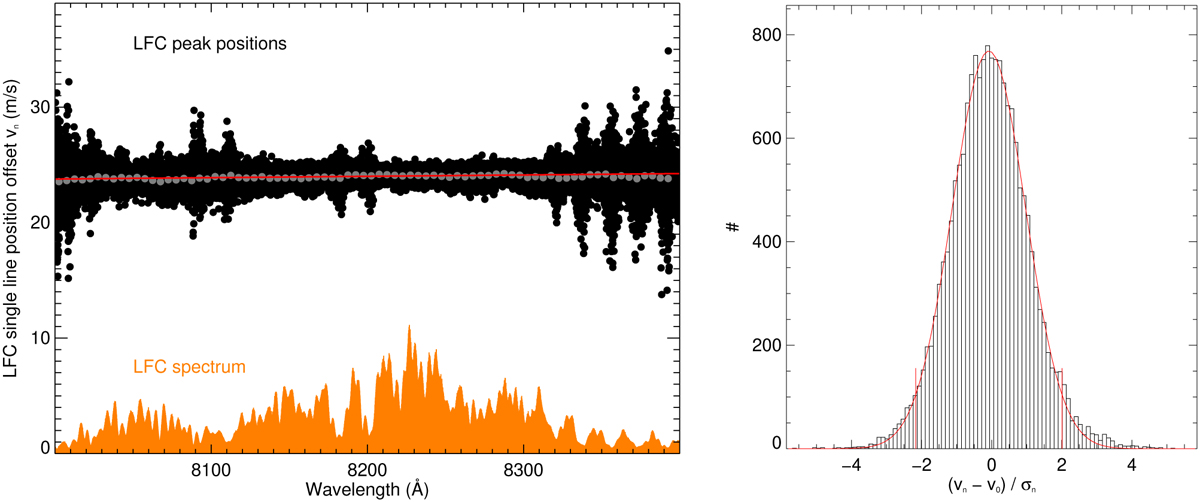
Measurements of LFC line positions. Left: measurements of 17,807 individual LFC peak positions, vn (black circles). Weighted means for bins of 5 Å in width are shown as gray circles. A linear fit to all measurements is shown as a red line; the small slope determined is not visible on this scale. The spectrum of the LFC is overplotted (orange) in linear arbitrary units. The width of the LFC peak position distribution is wider in the areas of lower signal. Right: histogram of residuals between observed and true LFC positions, vn , after subtracting the FTS zero point, v0 and normalized by the uncertainty of the measured line position, σn . The red curve indicates a Gaussian distribution with a 2σ interval indicated by the red vertical bars. The distribution is only 5% broader than expected from uncertainties, σn.
Current usage metrics show cumulative count of Article Views (full-text article views including HTML views, PDF and ePub downloads, according to the available data) and Abstracts Views on Vision4Press platform.
Data correspond to usage on the plateform after 2015. The current usage metrics is available 48-96 hours after online publication and is updated daily on week days.
Initial download of the metrics may take a while.