Fig. 2
Download original image
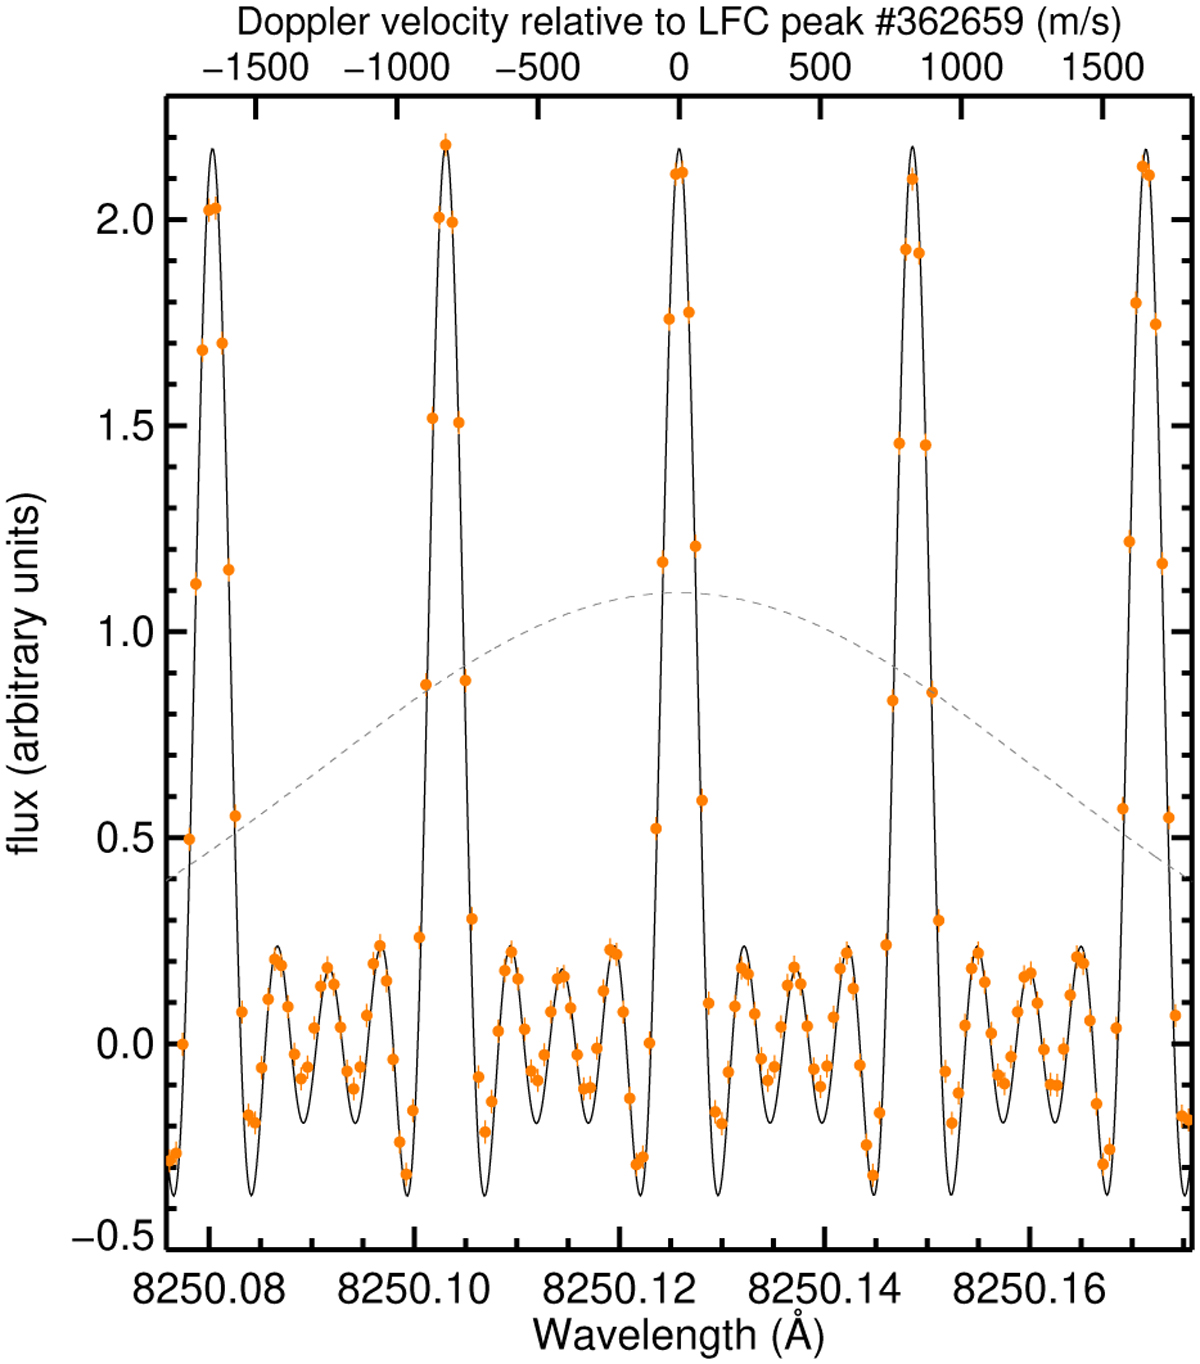
Zoom onto a spectrum of the LFC as observed with the FTS (orange circles with vertical bars for the estimated uncertainty) compared to the analytical description of the FTS instrumental line shape convolved with the LFC peak pattern around the comb tooth n = 362 659 (solid line). For comparison, the instrumental line shape of a spectrograph with a resolution of R = 100 000 is shown (dashed line).
Current usage metrics show cumulative count of Article Views (full-text article views including HTML views, PDF and ePub downloads, according to the available data) and Abstracts Views on Vision4Press platform.
Data correspond to usage on the plateform after 2015. The current usage metrics is available 48-96 hours after online publication and is updated daily on week days.
Initial download of the metrics may take a while.