Fig. 1
Download original image
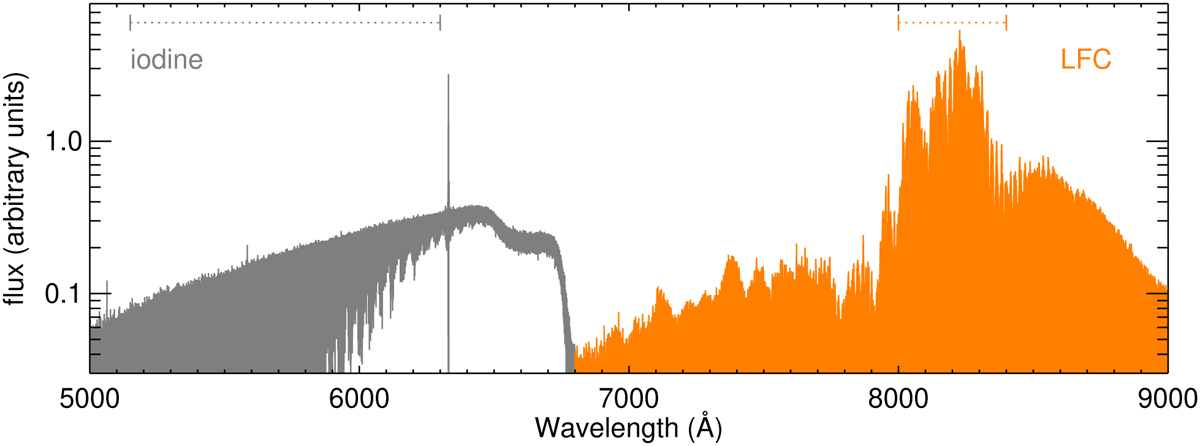
Spectrum of I2 absorption and the LFC as obtained with the FTS. Light of the two sources is combined with a dichroic beam splitter; at wavelengths shorter than 6800 Å, only light from the I2 absorption enters the spectrometer (gray). At longer wavelengths, the spectrum includes only the LFC spectrum (orange). The I2 spectrum follows the intensity of the illuminating lamp and shows the molecular absorption band structure with only very weak lines at long wavelengths beyond 6600Å (T ≈ 44°C). The feature at 6330Å is the HeNe reference laser of the FTS, and the dip at 6500 Å is caused by the transmission curve of the beam splitter. The LFC spectrum is highly dynamic and provides lines across the entire wavelength range and particularly strong lines in the range 8000–8400 Å. Wavelength ranges used for Doppler measurements in the I2 and LFC spectra are indicated with dashed lines at the top.
Current usage metrics show cumulative count of Article Views (full-text article views including HTML views, PDF and ePub downloads, according to the available data) and Abstracts Views on Vision4Press platform.
Data correspond to usage on the plateform after 2015. The current usage metrics is available 48-96 hours after online publication and is updated daily on week days.
Initial download of the metrics may take a while.