Fig. 7
Download original image
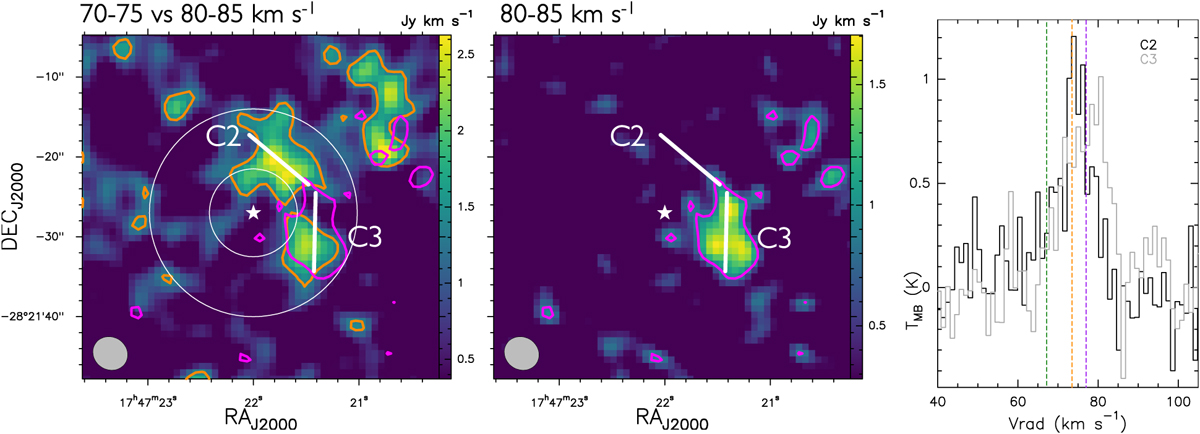
Identification of the condensations C2 and C3 from integrated-intensity maps and their extracted spectra. Left and central panels: colours show the HC3N(24–23) integrated-intensity maps in the velocity channels 70–75 and 80–85 km s–1. The orange contours correspond to half of the peak value of the 70–75 km s–1 map (1.7 Jy km s–1), and purple contours correspond to half of the peak value the 80–85 km s–1 map (2.6 Jy km s–1). The solid white lines represent the directions of the pv diagrams shown in Fig. 8. Right panel: spectrum extracted from the C2 condensation defined by the orange contours in the north (black histogram), and the spectrum extracted from the C3 condensation defined by the purple contours (grey histogram). The dashed vertical green, orange, and purple lines indicate the vLSR of the three components obtained from the LTE analysis (see Sect. 3.1).
Current usage metrics show cumulative count of Article Views (full-text article views including HTML views, PDF and ePub downloads, according to the available data) and Abstracts Views on Vision4Press platform.
Data correspond to usage on the plateform after 2015. The current usage metrics is available 48-96 hours after online publication and is updated daily on week days.
Initial download of the metrics may take a while.