Fig. 6
Download original image
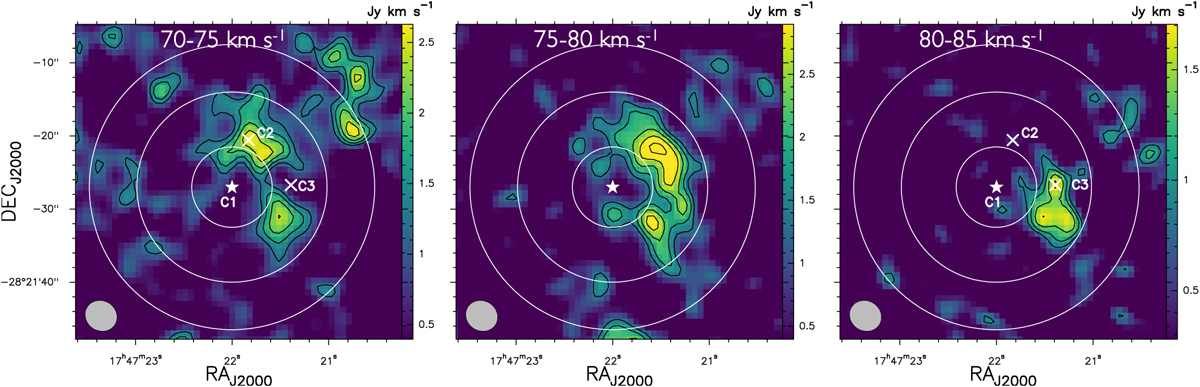
Same as Fig. 5 in the velocity ranges 70–75 km s–1 (left panel), 75–80 km s–1 (central panel), and 80–85 km s–1 (right panel). The 1σ rms is 0.397, 0.397, and 0.280 Jy km s–1 for the three maps, respectively. Positions C2 and C3 are indicated with white crosses in the left and right panels, whose coordinates are listed in Table 3.
Current usage metrics show cumulative count of Article Views (full-text article views including HTML views, PDF and ePub downloads, according to the available data) and Abstracts Views on Vision4Press platform.
Data correspond to usage on the plateform after 2015. The current usage metrics is available 48-96 hours after online publication and is updated daily on week days.
Initial download of the metrics may take a while.