Fig. 5
Download original image
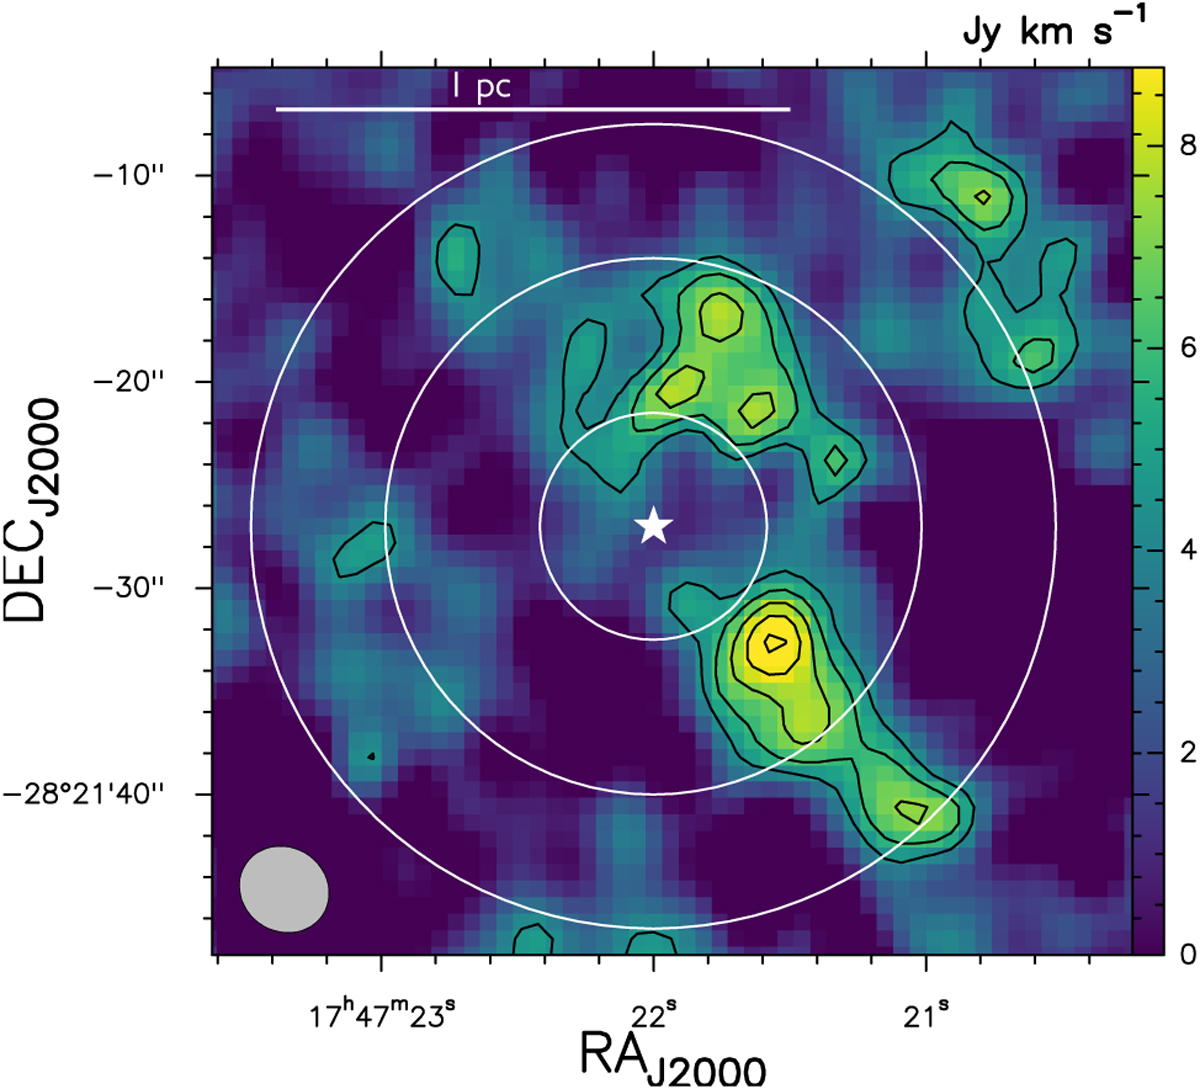
HC3N(24–23) integrated-intensity map in the velocity range 56– 80 km s–1. The contour levels are 3, 4, 5, and 6 times the 1σ rms of the map, equal to 1.215 Jy km s–1. The white star indicates the position of G+0.693 towards which single-dish observations are centred (C1). The white circles show the IRAM 30m and APEX beams at 218.324 GHz (11″ and 27″, respectively), and the maximum beam of the single-dish observations studied in this work, which is 39″ from the Yebes beam at 45.490 GHz (HC3N(5–4)). The interferometric synthesised beam (474 × 470) is the ellipse indicated in the lower left corner. In the top part, the solid white line indicates the spatial scale of 1 pc.
Current usage metrics show cumulative count of Article Views (full-text article views including HTML views, PDF and ePub downloads, according to the available data) and Abstracts Views on Vision4Press platform.
Data correspond to usage on the plateform after 2015. The current usage metrics is available 48-96 hours after online publication and is updated daily on week days.
Initial download of the metrics may take a while.