Fig. 4
Download original image
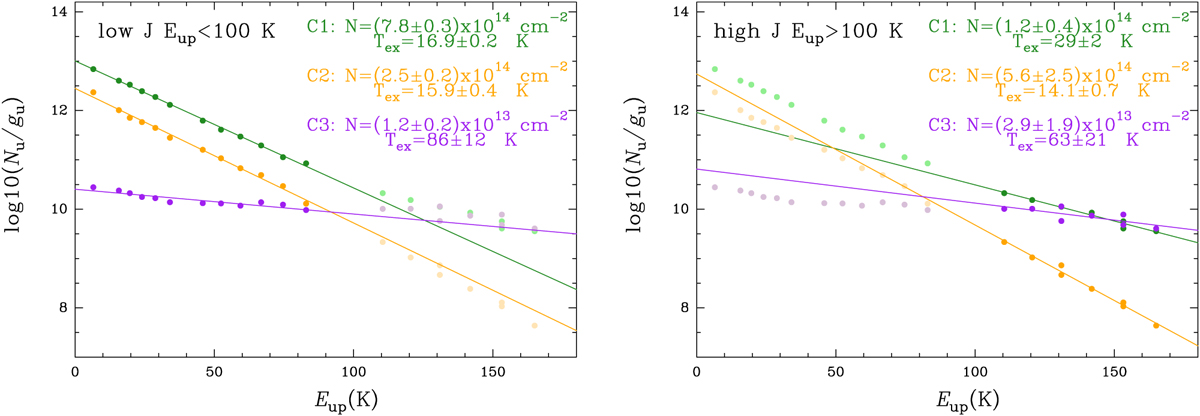
Rotational diagram from the low- J (with solid points in the left panel with Eup < 100 K) and high- J (with solid points in the right panel with Eup > 100 K) transitions shown in Fig. 1 and listed in Table 1, taking the contributions of the three line components into account. The green, orange, and purple points correspond to components C1, C2, and C3, respectively. The solid coloured lines represent a linear regression fit of the points corresponding to the same component, and the final N and Tex are shown in the upper right corner. For the low-J rotational diagram, the high-J points are shown with lighter colours for completeness, and vice versa.
Current usage metrics show cumulative count of Article Views (full-text article views including HTML views, PDF and ePub downloads, according to the available data) and Abstracts Views on Vision4Press platform.
Data correspond to usage on the plateform after 2015. The current usage metrics is available 48-96 hours after online publication and is updated daily on week days.
Initial download of the metrics may take a while.