Fig. 3
Download original image
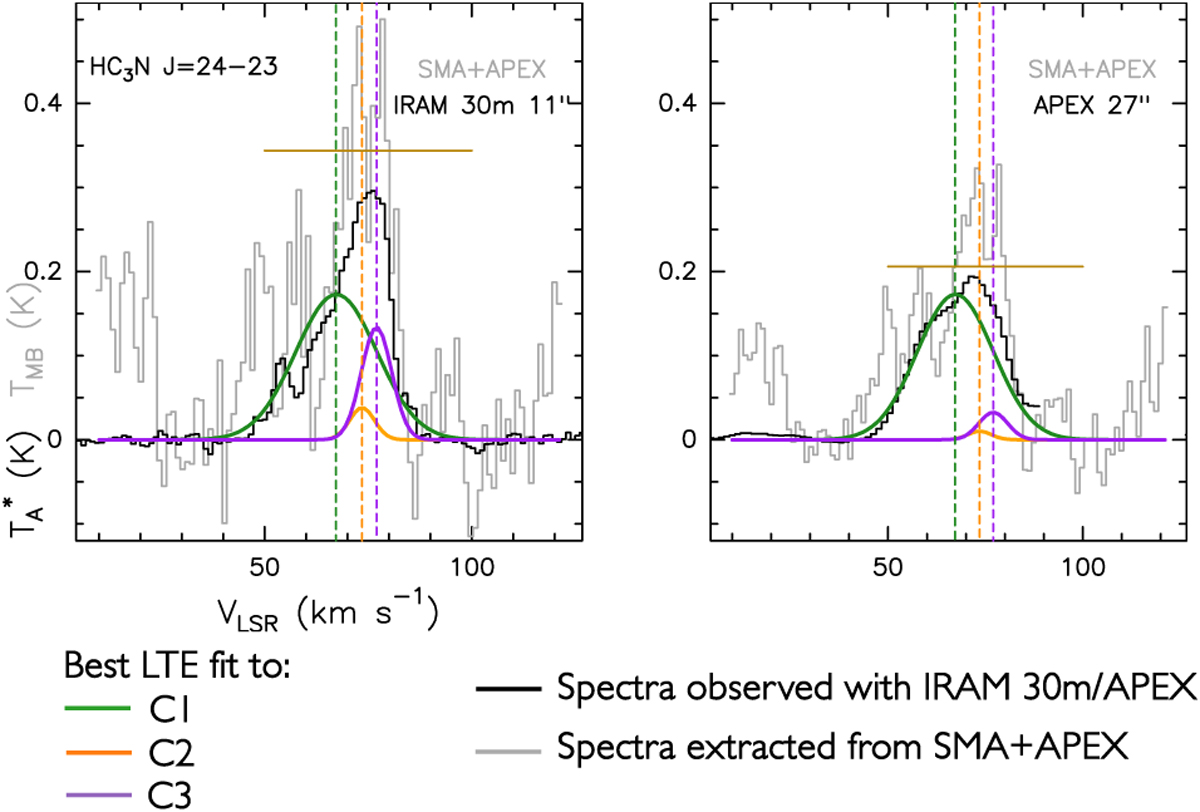
Comparison between single-pointing single-dish spectra and spectra extracted from SMA+APEX data cubes. Left panel: HC3N(24– 23) spectrum observed with IRAM 30m (black histogram) together with the LTE predictions of the three components (see Fig. 1 for more information about the coloured lines). Right panel: same as the left panel, but for the APEX spectrum. In both panels, the spectrum extracted from the HC3N(24–23) SMA+APEX cube (grey histograms) is shown for comparison in a region equal to the IRAM 30m beam of 11″ and to the APEX beam of 27″ (left and right panels, respectively), and centred on G+0.693 (in TMB; see Sect. 3.2 for more information about the maps). In both panels, the solid dark gold horizontal line indicates the peak of the simulated LTE spectrum, obtained by converting the narrow line peaks (components C2 and C3) from ![]() to TMB. The dashed vertical lines correspond to the 3LSR of the three components (see Table 2 for high-J transitions).
to TMB. The dashed vertical lines correspond to the 3LSR of the three components (see Table 2 for high-J transitions).
Current usage metrics show cumulative count of Article Views (full-text article views including HTML views, PDF and ePub downloads, according to the available data) and Abstracts Views on Vision4Press platform.
Data correspond to usage on the plateform after 2015. The current usage metrics is available 48-96 hours after online publication and is updated daily on week days.
Initial download of the metrics may take a while.