Fig. B.1
Download original image
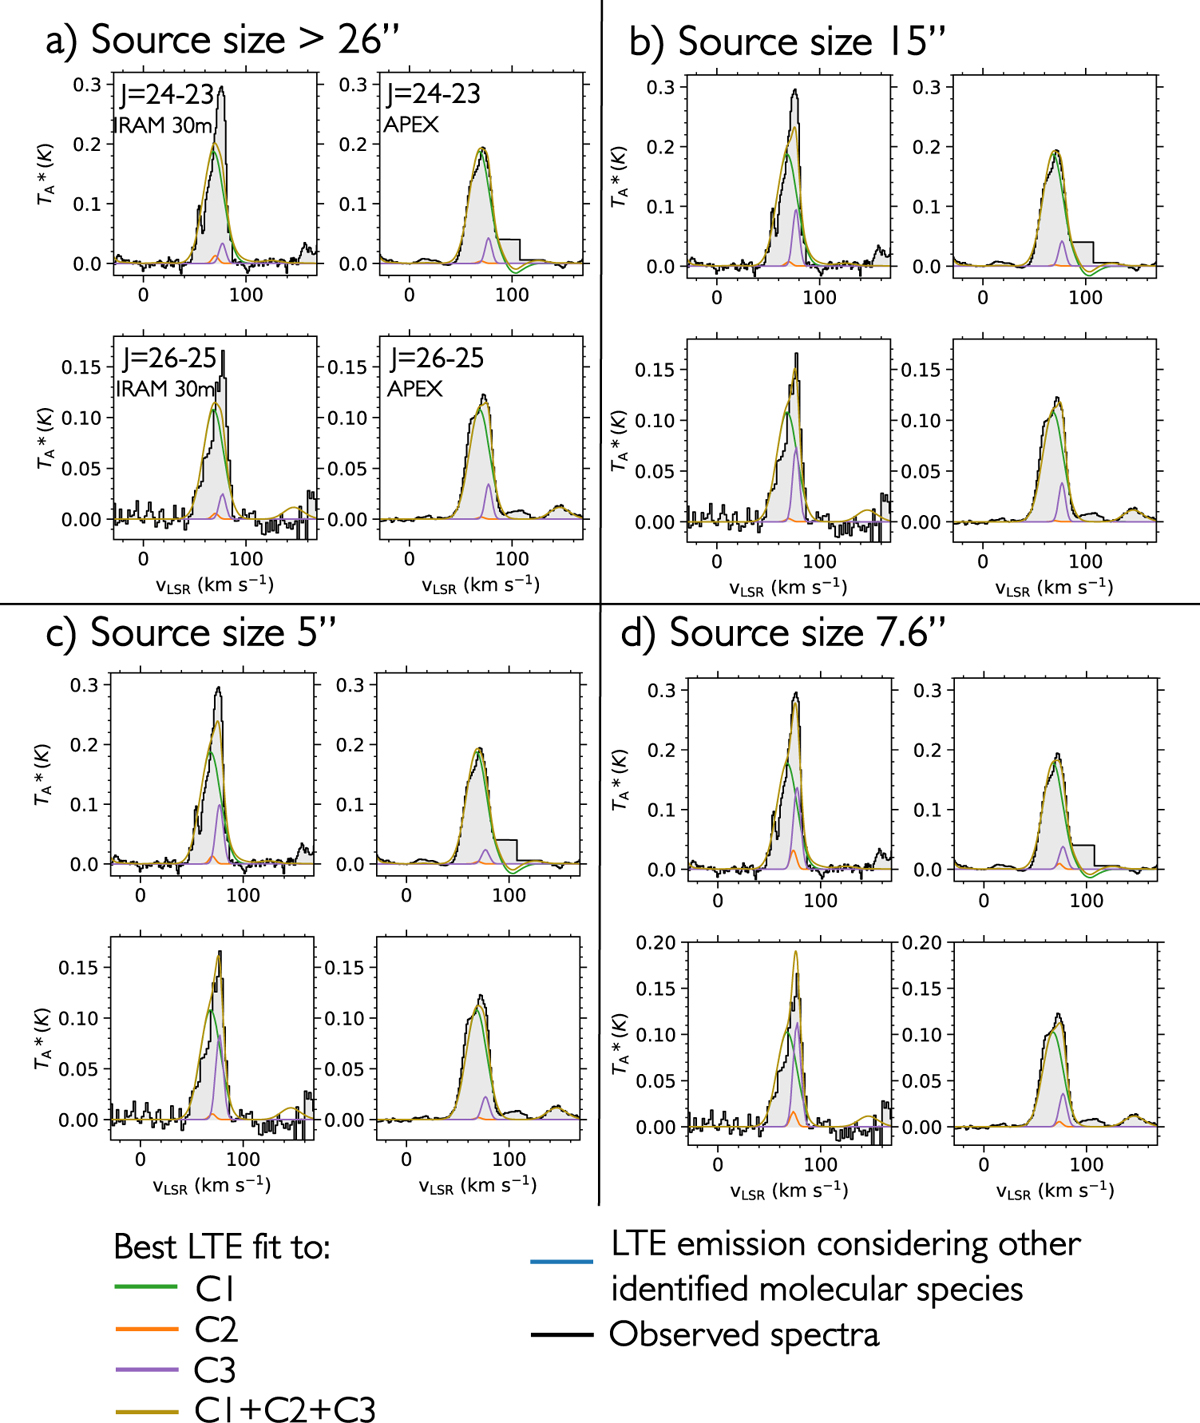
Same as Fig. 1 but for the transitions J=24−23 and 26−25, observed both with the IRAM 30m and APEX. Each of the four panel represent the best LTE fitted spectra obtained changing the source size for the C3 (purple) component. A source size smaller than 10″ is needed to explain the higher velocity peaks seen with the IRAM 30m, i.e. with a lower angular resolution than with APEX.
Current usage metrics show cumulative count of Article Views (full-text article views including HTML views, PDF and ePub downloads, according to the available data) and Abstracts Views on Vision4Press platform.
Data correspond to usage on the plateform after 2015. The current usage metrics is available 48-96 hours after online publication and is updated daily on week days.
Initial download of the metrics may take a while.