Fig. 11
Download original image
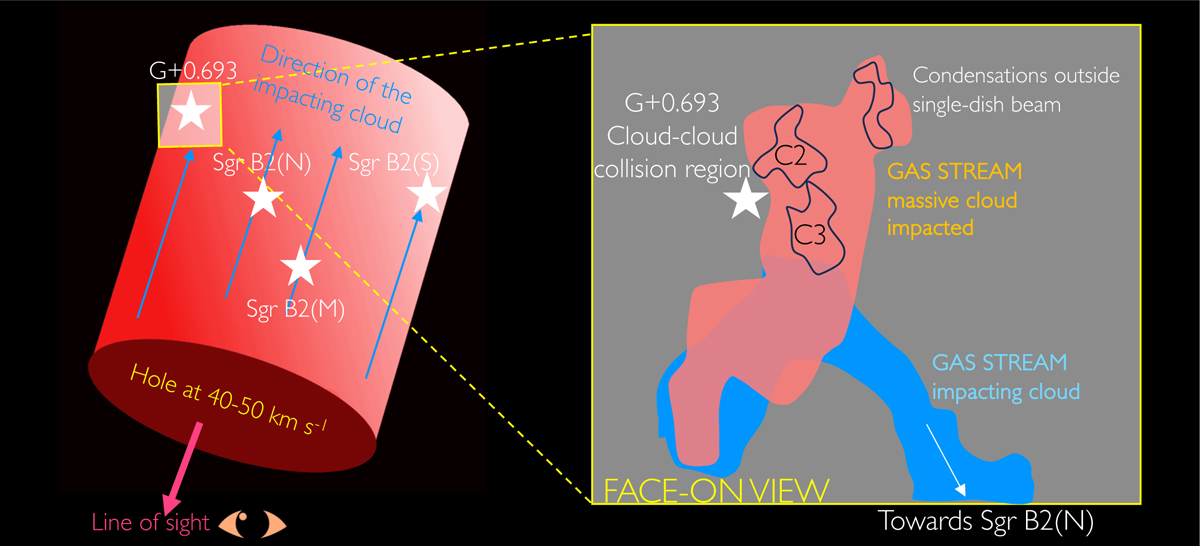
Sketch of the Sgr B2 region formation scenario. Left panel: in this scenario, Sgr B2(M) is firstly formed during the impact of the small cloud, followed by Sgr B2(N), Sgr B2(S), and G+0.693. These four sources are indicated with white stars. The red cylinder represents the large impacted massive cloud (with velocities of 60–80 km s−1), and the blue arrows indicate the possible direction of the smaller impacting cloud, which creates the hole at 40–50 km s−1. The transparent white rectangle represents the region that is zoomed-in the right panel. Right panel: face-on view along the line of sight of G+0.693. The blue- and red-shifted regions are drawn from the blue- (50–60 km s−1) and red-shifted (70–90 km s−1) CH3OH (4−3) integrated intensity by Zeng et al. (2020). The C2 and C3 condensations are those defined in Fig. 8. The north-west region represents a group of condensations seen in the left panel of Fig. 6, but which mainly falls outside the single-dish beams of the observations used in this work (see Table 1). The white star shows the central position of the single-dish observations and probably is the centre of the cloud-cloud collision between the two gas streams. The red gas stream, border of the cylinder, represents the massive cloud that is impacted and tracked by the smaller cloud, i.e. the blue gas stream.
Current usage metrics show cumulative count of Article Views (full-text article views including HTML views, PDF and ePub downloads, according to the available data) and Abstracts Views on Vision4Press platform.
Data correspond to usage on the plateform after 2015. The current usage metrics is available 48-96 hours after online publication and is updated daily on week days.
Initial download of the metrics may take a while.