Fig. 10
Download original image
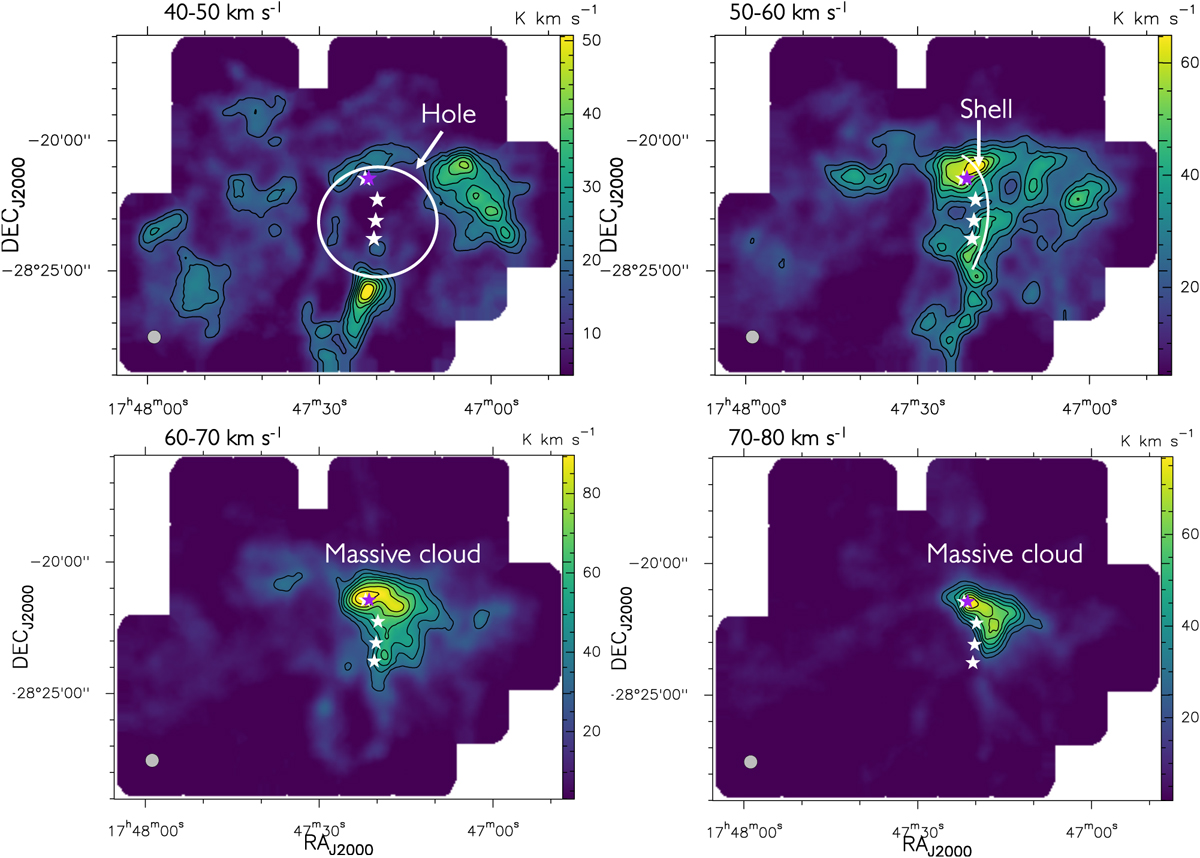
HNCO (40,4–30,3) moment 0 maps obtained in the velocity ranges 40–50 km s–1 (top left panel, the hole), 50–60 km s–1 (top right panel), 60–70 km s–1 (bottom left panel, the shell), and 70–80 km s–1 (bottom right panel, the clump). The contour levels are 0.1 steps from the maximum of the maps (50, 65, 90, and 77 K km s–1, respectively). The synthesised beam is the ellipse indicated in the lower left corner (2975 × 2975). The white stars are Sgr B2(S), (M), (N), and G+0.693 from the south to the north, and the purple star is the C3 condensation.
Current usage metrics show cumulative count of Article Views (full-text article views including HTML views, PDF and ePub downloads, according to the available data) and Abstracts Views on Vision4Press platform.
Data correspond to usage on the plateform after 2015. The current usage metrics is available 48-96 hours after online publication and is updated daily on week days.
Initial download of the metrics may take a while.