Fig. 1
Download original image
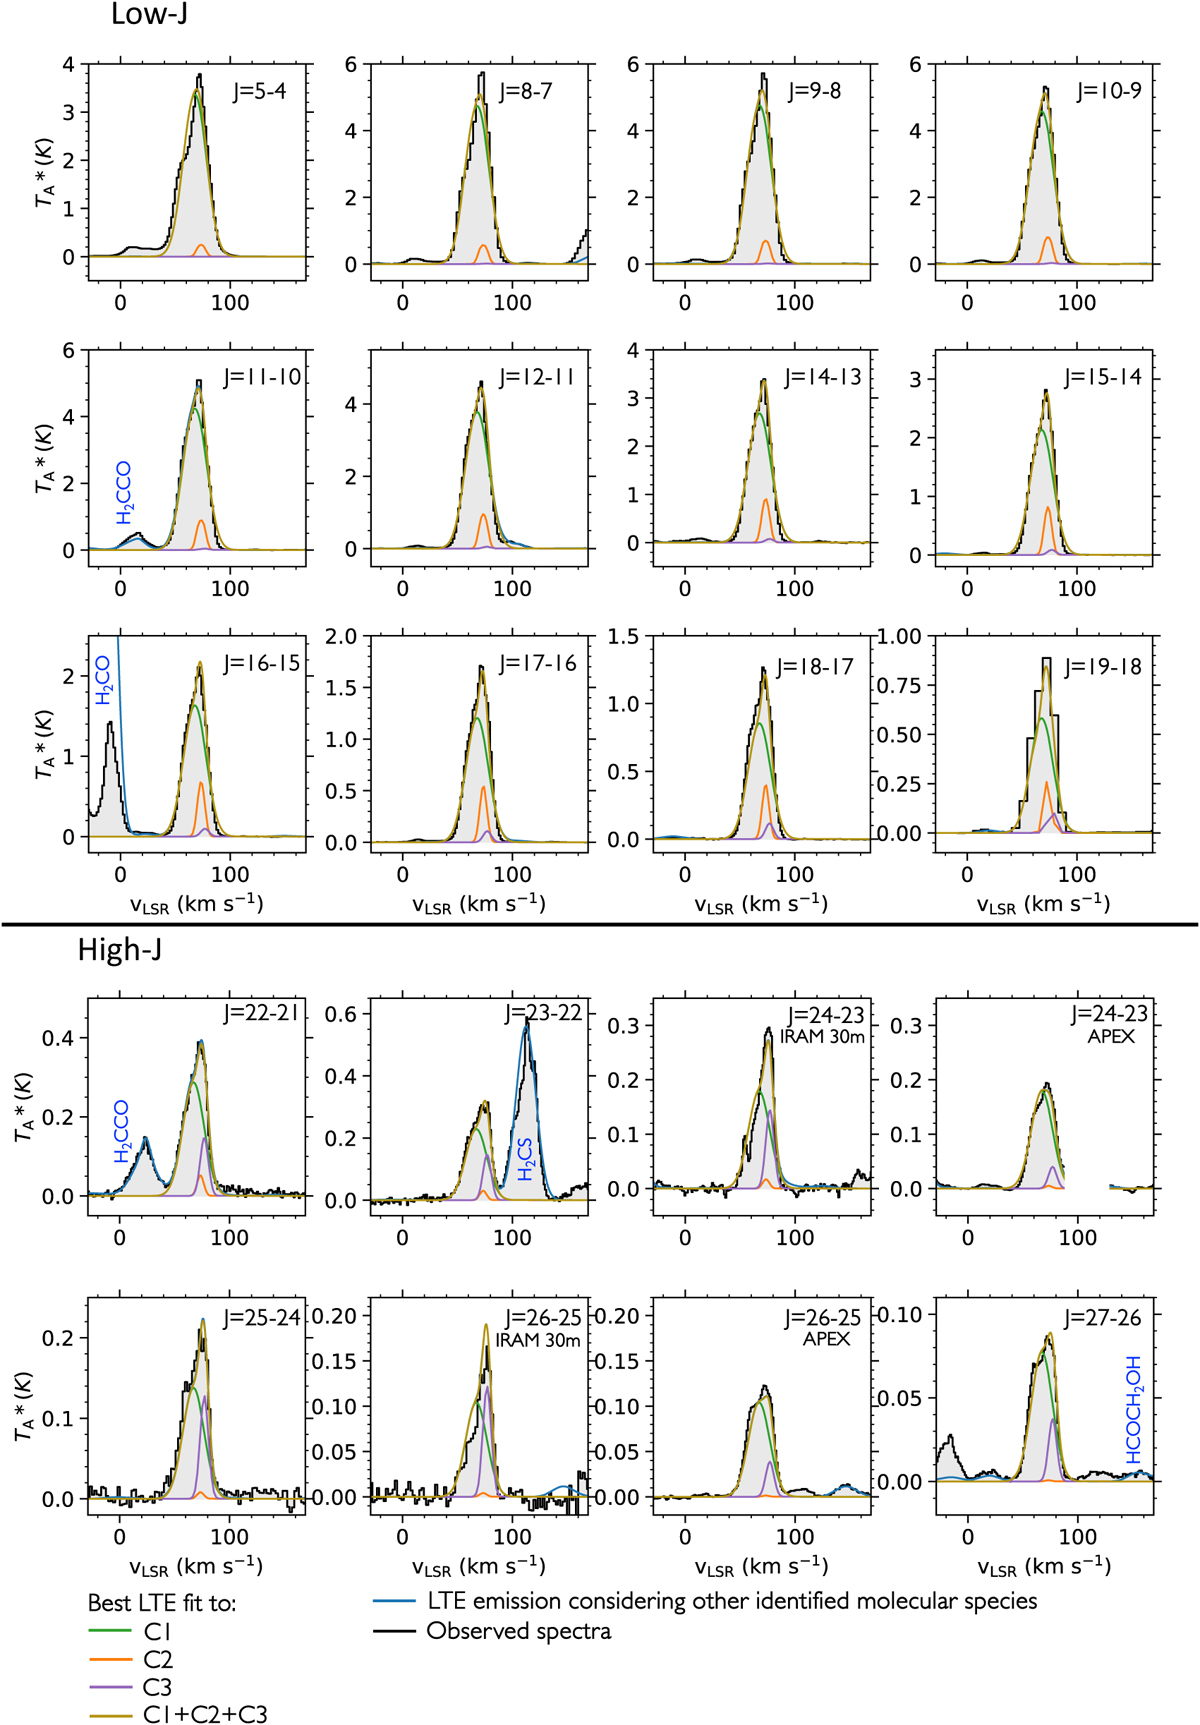
HC3N observed transitions used for the LTE analysis (black histrograms). The transitions are divided into two groups, the low-J group from J=5–4 up J=19–18, and the high-J group from J=22–21 up to J=27–26, in the top and bottom row, respectively. For each panel, the corresponding transition is indicated in the upper right corner, and the telescope information is given when the same transition was observed with more than one instrument. The solid green, orange, and purple lines are the best LTE fit to components C1, C2, and C3, respectively. The dark gold line is the sum of the three components. The blue line indicates the total modelled line emission that also includes the contribution of all molecular species previously identified in the survey (e.g. Zeng et al. 2018; Rodríguez-Almeida et al. 2021b,a; Rivilla et al. 2021b; Sanz-Novo et al. 2023). More information about the observed transitions is given in Table 1.
Current usage metrics show cumulative count of Article Views (full-text article views including HTML views, PDF and ePub downloads, according to the available data) and Abstracts Views on Vision4Press platform.
Data correspond to usage on the plateform after 2015. The current usage metrics is available 48-96 hours after online publication and is updated daily on week days.
Initial download of the metrics may take a while.