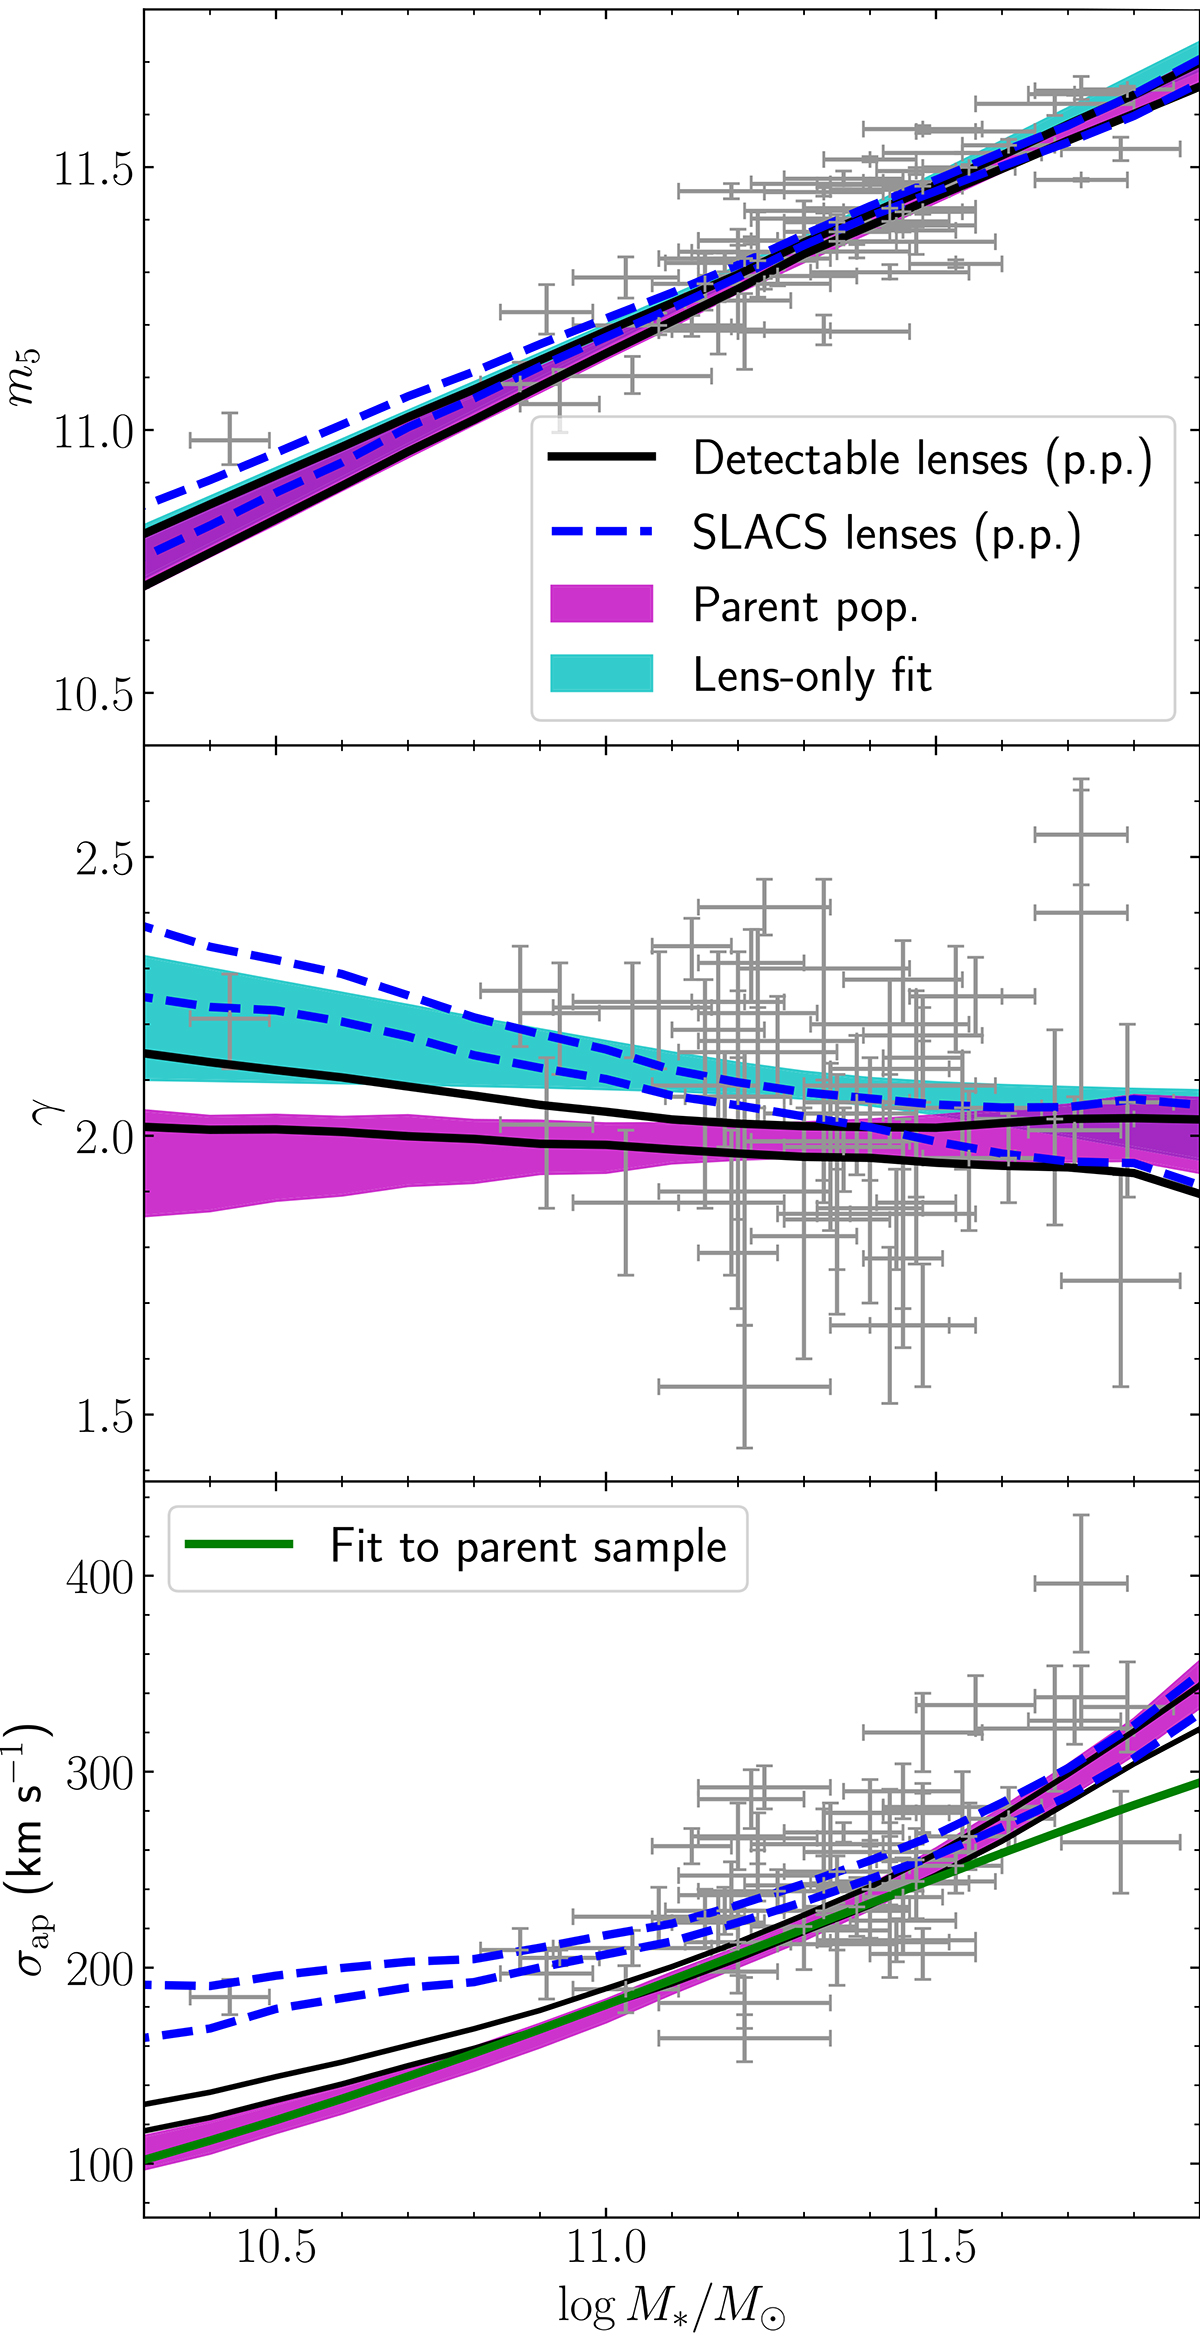
Fig. 8.
Download original image
Posterior predicted trends with stellar mass, for galaxies of average size. Top: average projected mass enclosed within 5 kpc. Middle: average density slope. Bottom: average stellar velocity dispersion. Each band marks the 68% credible region. The magenta band shows the prediction for the parent population. The cyan band shows the prediction from the lens-only analysis, without accounting for selection effects. Dashed blue lines show the prediction for the population of SLACS lenses. Solid black lines show the prediction for the population of detectable lenses (obtained by removing the lens finding probability Pfind from the posterior prediction). Error bars are the values measured for the SLACS lenses, assuming a flat prior on both m5 and γ. Uncertainties on the stellar mass are uncorrelated with those on m5, γ and σap. In the bottom panel, the green line shows our quadratic fit to the m* − σap relation of the parent sample.
Current usage metrics show cumulative count of Article Views (full-text article views including HTML views, PDF and ePub downloads, according to the available data) and Abstracts Views on Vision4Press platform.
Data correspond to usage on the plateform after 2015. The current usage metrics is available 48-96 hours after online publication and is updated daily on week days.
Initial download of the metrics may take a while.