Open Access
Fig. 3.
Download original image
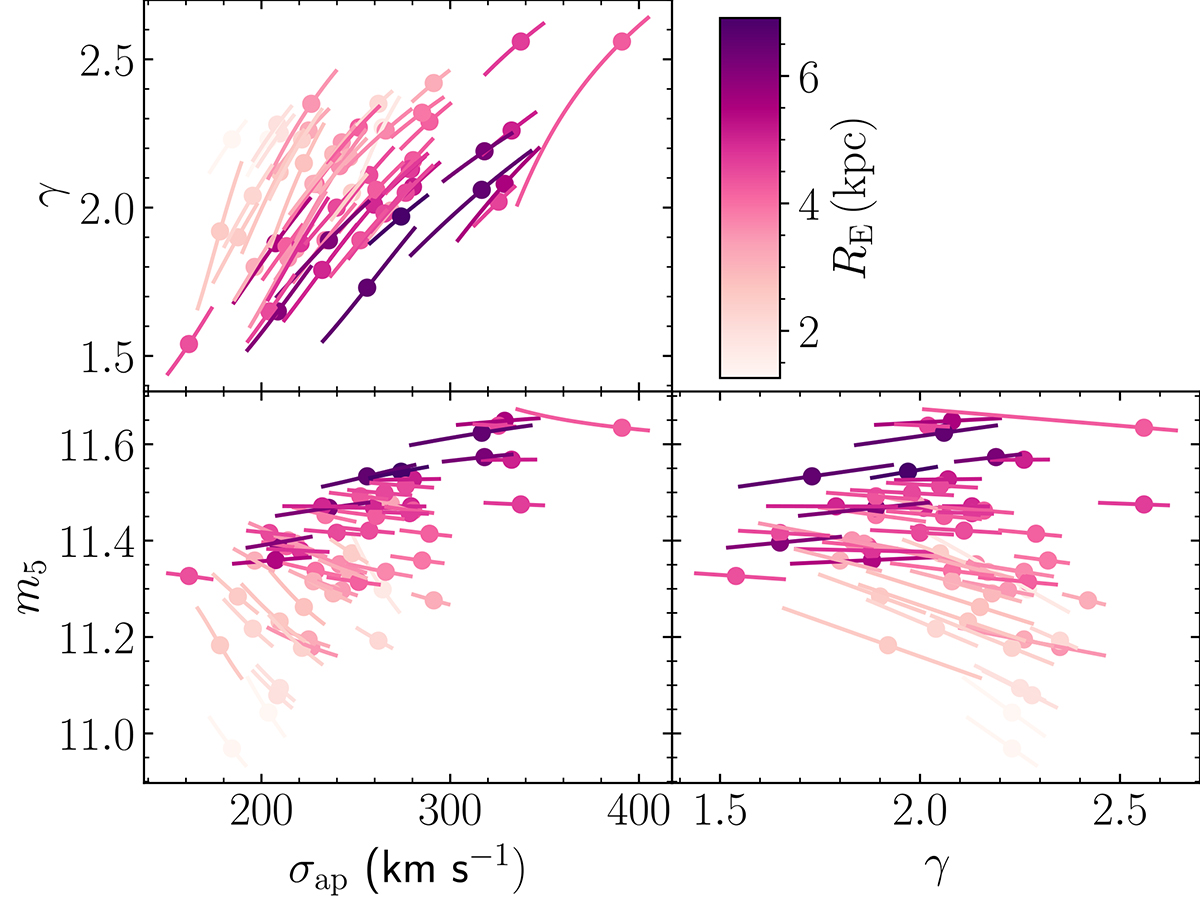
Constraints on m5 and γ, and predicted values of the velocity dispersion, for individual lenses. Each line covers the 68% credible region of the posterior probability. Lines are colour-coded by the physical size of the Einstein radius. Dots mark the maximum posterior probability values.
Current usage metrics show cumulative count of Article Views (full-text article views including HTML views, PDF and ePub downloads, according to the available data) and Abstracts Views on Vision4Press platform.
Data correspond to usage on the plateform after 2015. The current usage metrics is available 48-96 hours after online publication and is updated daily on week days.
Initial download of the metrics may take a while.