Fig. 11.
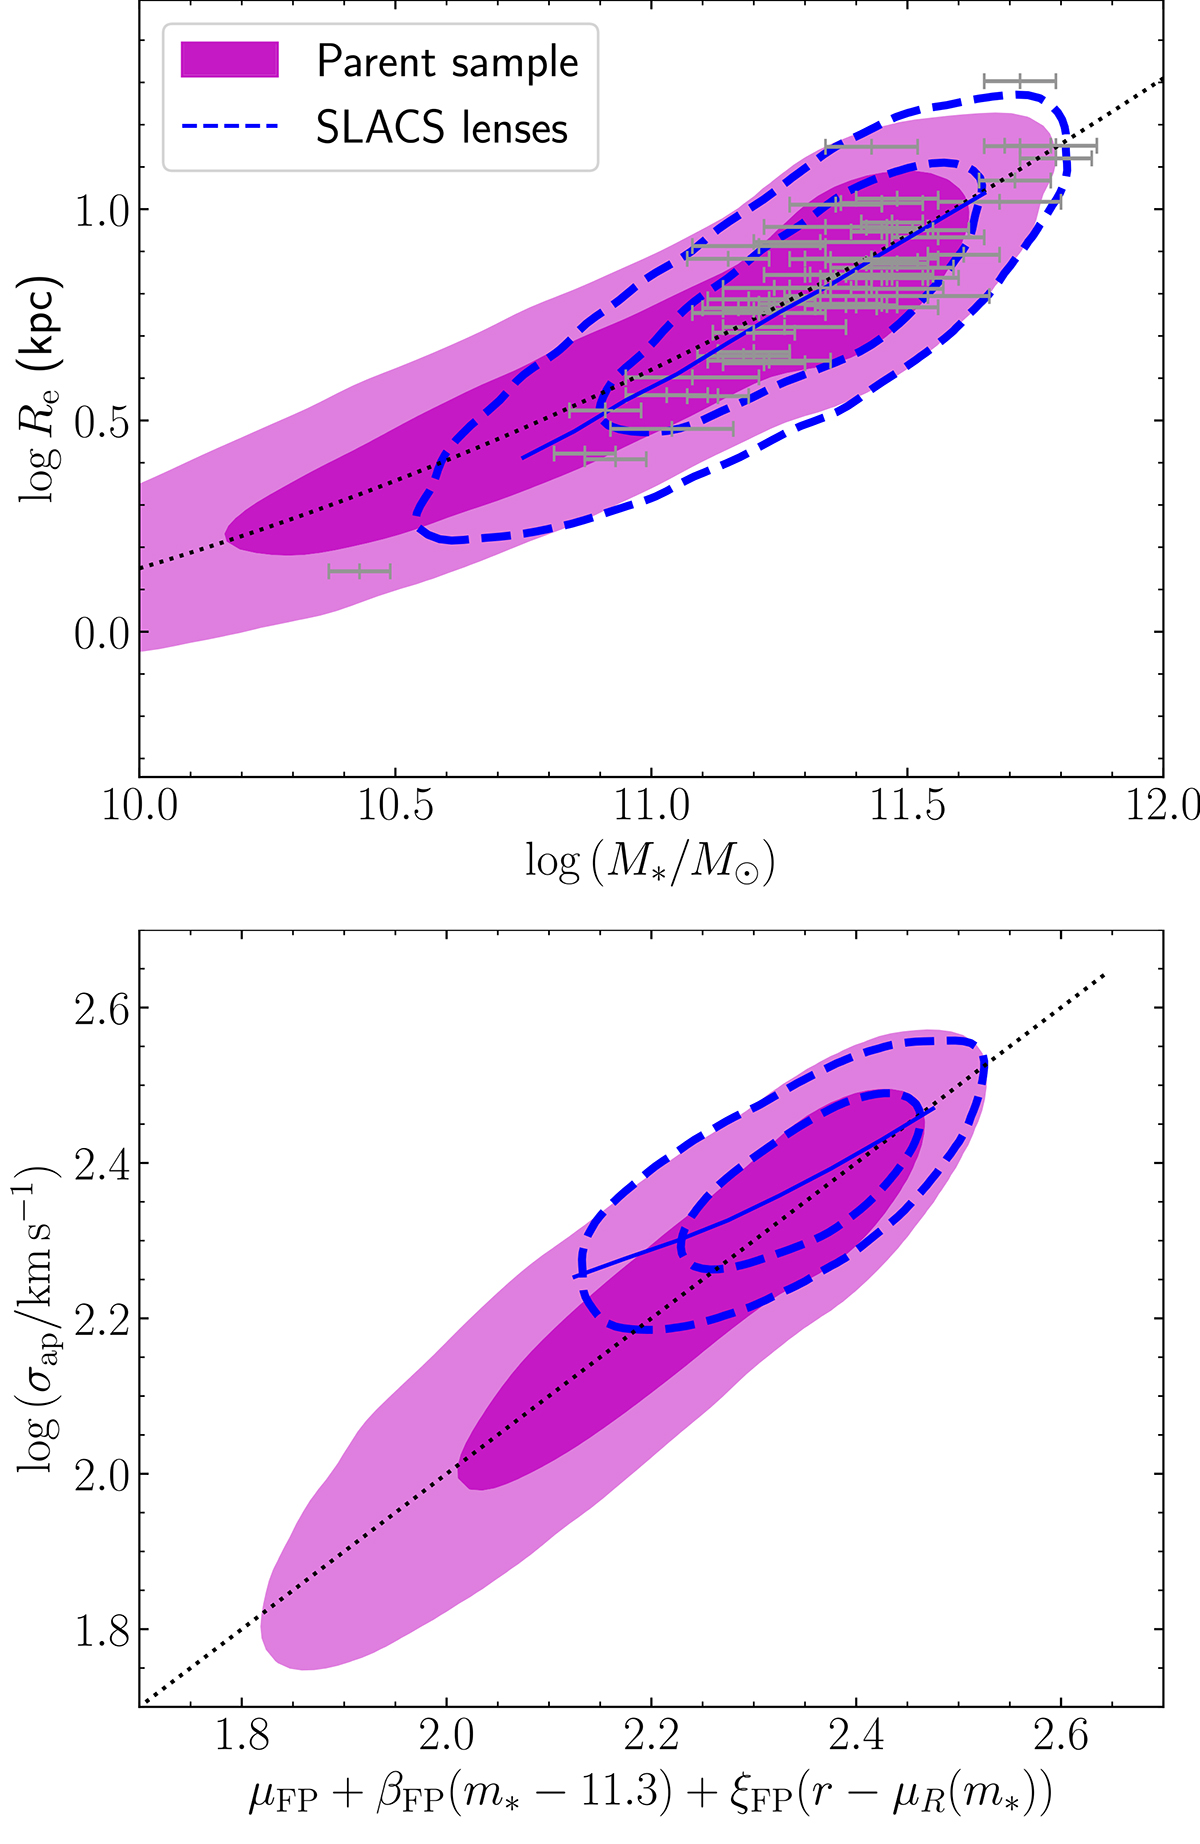
Download original image
Posterior predicted mass-size and fundamental plane relation. Top: distribution in stellar mass and half-light radius of the parent population (magenta regions) and the SLACS lenses (dashed contours), marginalised over the model parameters η. The dotted black line is the mass-size relation from Hyde & Bernardi (2009). The solid blue line indicates the average size of SLACS lenses as a function of stellar mass. Bottom: distribution in velocity dispersion, as a function of the predicted average given the stellar mass and size (the mean of the distribution in Equation (36)). The solid blue line indicates the average velocity dispersion of the SLACS lenses.
Current usage metrics show cumulative count of Article Views (full-text article views including HTML views, PDF and ePub downloads, according to the available data) and Abstracts Views on Vision4Press platform.
Data correspond to usage on the plateform after 2015. The current usage metrics is available 48-96 hours after online publication and is updated daily on week days.
Initial download of the metrics may take a while.