Fig. 1.
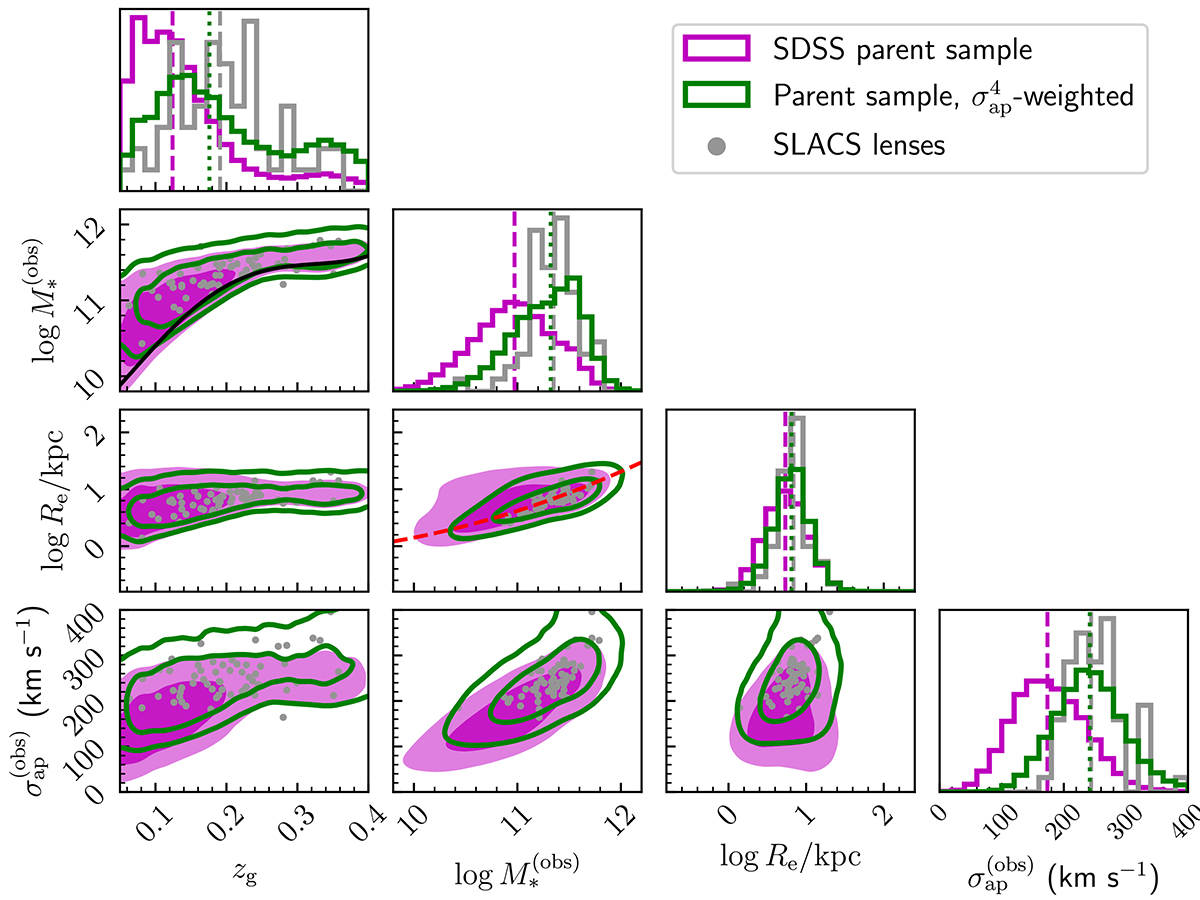
Download original image
SLACS lenses and parent population. Distribution in redshift, observed stellar mass, half-light radius, and stellar velocity dispersion. The green contours and histograms are obtained by weighting the parent sample distribution by σap4. Vertical dashed or dotted lines indicate the median of the distributions of the corresponding colour. Contours enclose 68% and 95% of the distribution. Half-light radius measurements of the parent population were not used in our analysis. Instead, we assumed a stellar mass-size relation from Hyde & Bernardi (2009), which is shown as a dashed red line. The black line in the redshift-stellar mass panel is the inferred truncation stellar mass mt, introduced in section 4.2.
Current usage metrics show cumulative count of Article Views (full-text article views including HTML views, PDF and ePub downloads, according to the available data) and Abstracts Views on Vision4Press platform.
Data correspond to usage on the plateform after 2015. The current usage metrics is available 48-96 hours after online publication and is updated daily on week days.
Initial download of the metrics may take a while.