Fig. A.1
Download original image
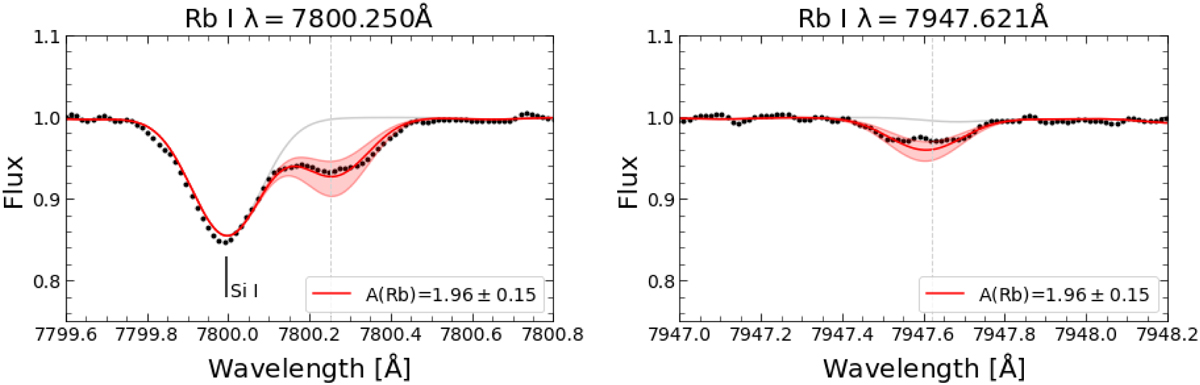
Observed (black dots) and synthetic spectra of 2M00044180 around the two Rb I lines at 7800.250 Å (left panel) and 7947.612 Å (right panel). The synthetic spectra were computed for A(Rb)=−∞ (gray line) and for the final abundance from Table 2 (red line), given by the average abundance over the lines. The red shaded area corresponds to abundance variations within the amount of the standard deviation.
Current usage metrics show cumulative count of Article Views (full-text article views including HTML views, PDF and ePub downloads, according to the available data) and Abstracts Views on Vision4Press platform.
Data correspond to usage on the plateform after 2015. The current usage metrics is available 48-96 hours after online publication and is updated daily on week days.
Initial download of the metrics may take a while.