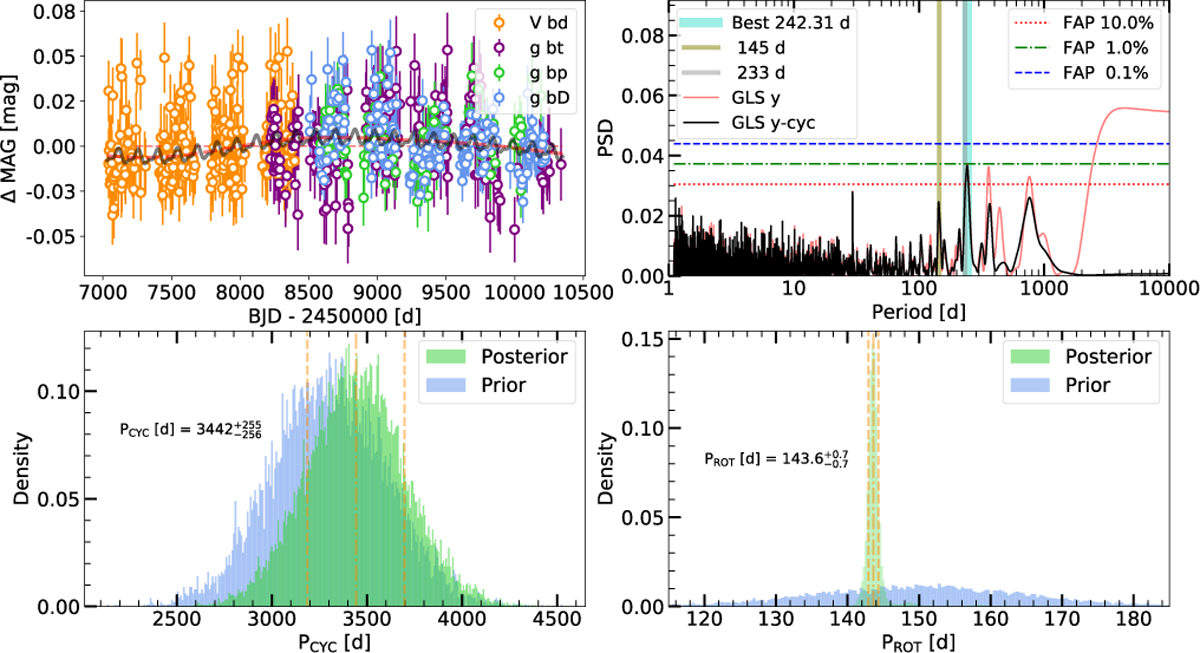
Fig. 5
Download original image
ASAS-SN photometry in the same temporal baseline as the RV data together with the double sinusoidal models of the long-term cycle and rotation signals (top left) and the GLS periodogram before and after subtracting the long-term cycle (top right). The posterior and prior distributions of these models including the long-term cycle (bottom left) and rotation periods (bottom right).
Current usage metrics show cumulative count of Article Views (full-text article views including HTML views, PDF and ePub downloads, according to the available data) and Abstracts Views on Vision4Press platform.
Data correspond to usage on the plateform after 2015. The current usage metrics is available 48-96 hours after online publication and is updated daily on week days.
Initial download of the metrics may take a while.