Fig. C.1
Download original image
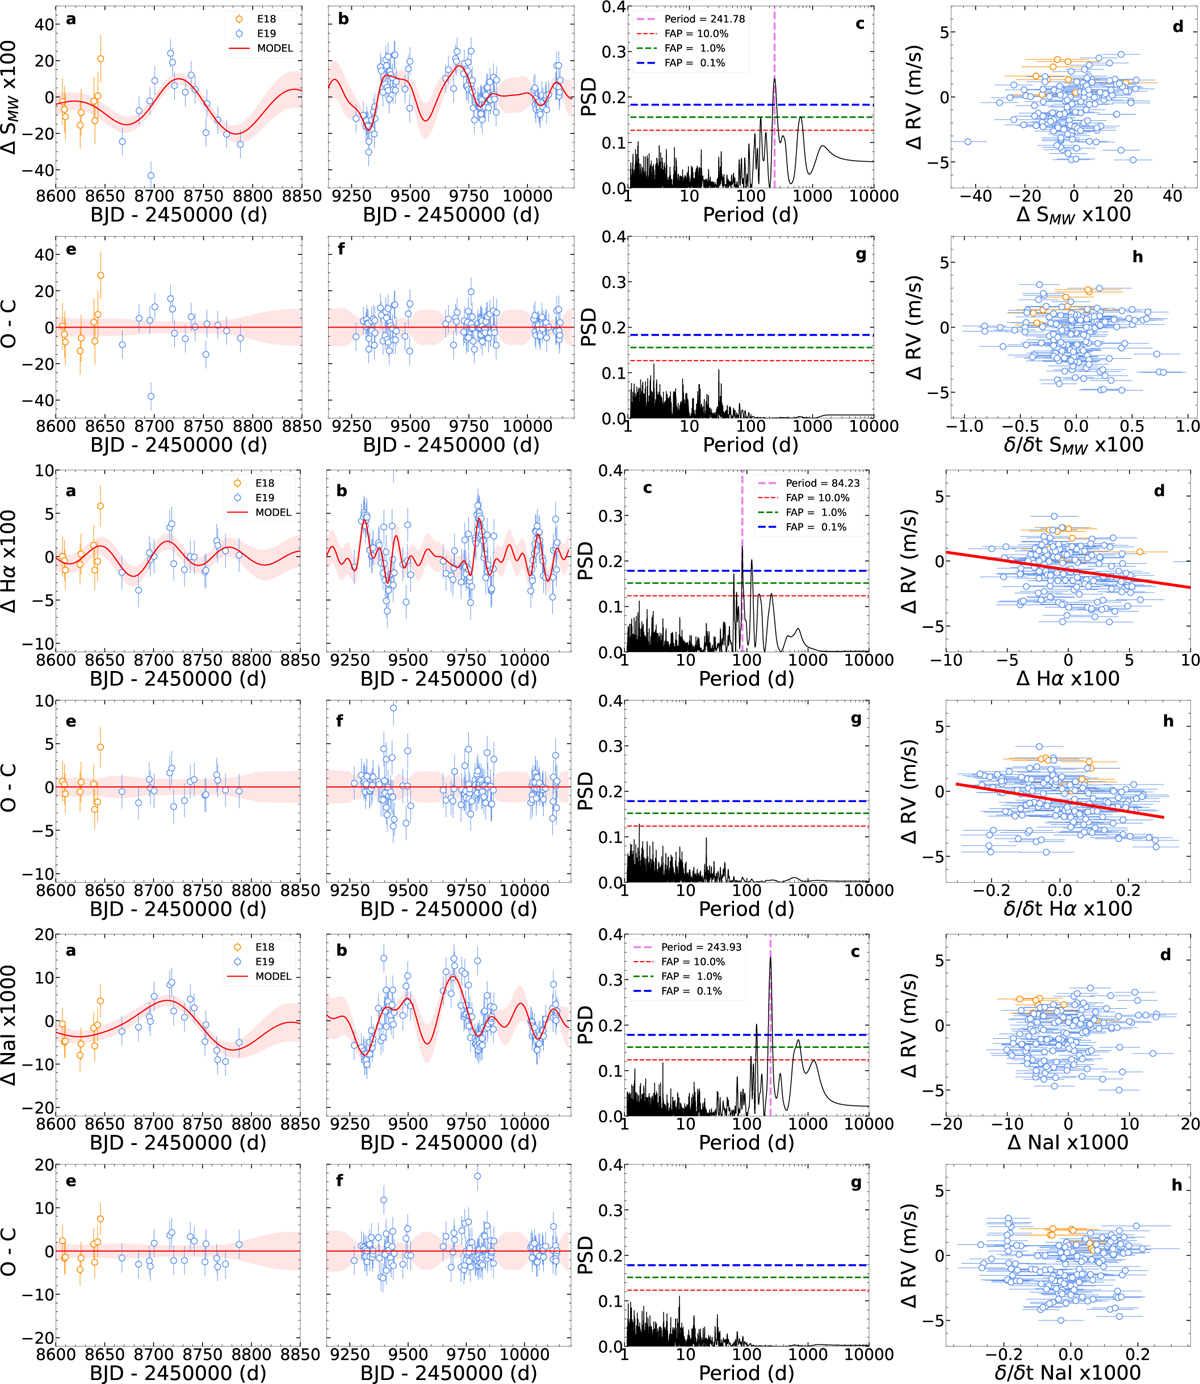
Analysis of the ESPRESSO SMW, Hα and Na I spectroscopic indexes, a, b: SMW, Hα and Na I-index time-series with the best-model fit. The data is split into two panels because of a large period with no observations between the two campaigns. The shaded area shows the variance of the GP model, c: GLS periodogram of the SMW, Hα and Na I-index data. The red vertical dashed line shows the most significant period, d: Relationship between the SMW, Hα and Na I-index data. The best fit is shown when the slope is ≥3σ different from zero, e, f: Residuals of the SMW, Hα and Na I-index after subtracting the best model fit. g: GLS periodogram of the residuals, h: Comparison of the CCF RV and gradient of the SMW, Hα and Na I-index model.
Current usage metrics show cumulative count of Article Views (full-text article views including HTML views, PDF and ePub downloads, according to the available data) and Abstracts Views on Vision4Press platform.
Data correspond to usage on the plateform after 2015. The current usage metrics is available 48-96 hours after online publication and is updated daily on week days.
Initial download of the metrics may take a while.