Fig. 5
Download original image
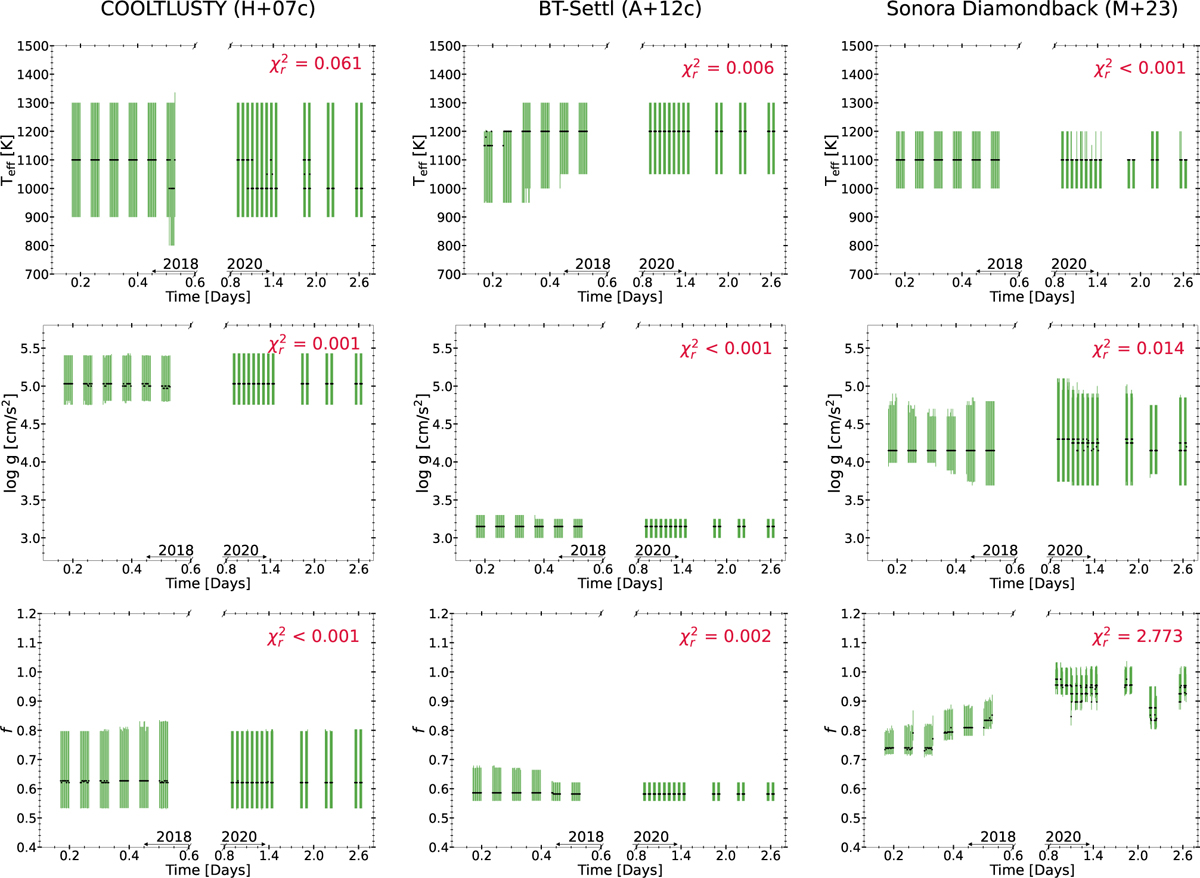
Machine learning retrieval outputs for legacy model grids. From left to right: COOLTLUSTY from Hubeny & Burrows (2007), BT-Settl by Allard et al. (2012), and Sonora Diamondback by Morley et al. (2024). The HST exposures cover data from 2018 (66) and 2020 (165), where the x-axes are broken to fit the two epochs of data. Each orbit consists of 11 intra-orbit spectra. Posterior median values are indicated as black dots, while the corresponding error bars are shown in green. The represented reduced chi-square values correspond to a fit of a straight line through all posteriors of a given parameter.
Current usage metrics show cumulative count of Article Views (full-text article views including HTML views, PDF and ePub downloads, according to the available data) and Abstracts Views on Vision4Press platform.
Data correspond to usage on the plateform after 2015. The current usage metrics is available 48-96 hours after online publication and is updated daily on week days.
Initial download of the metrics may take a while.