Fig. 4
Download original image
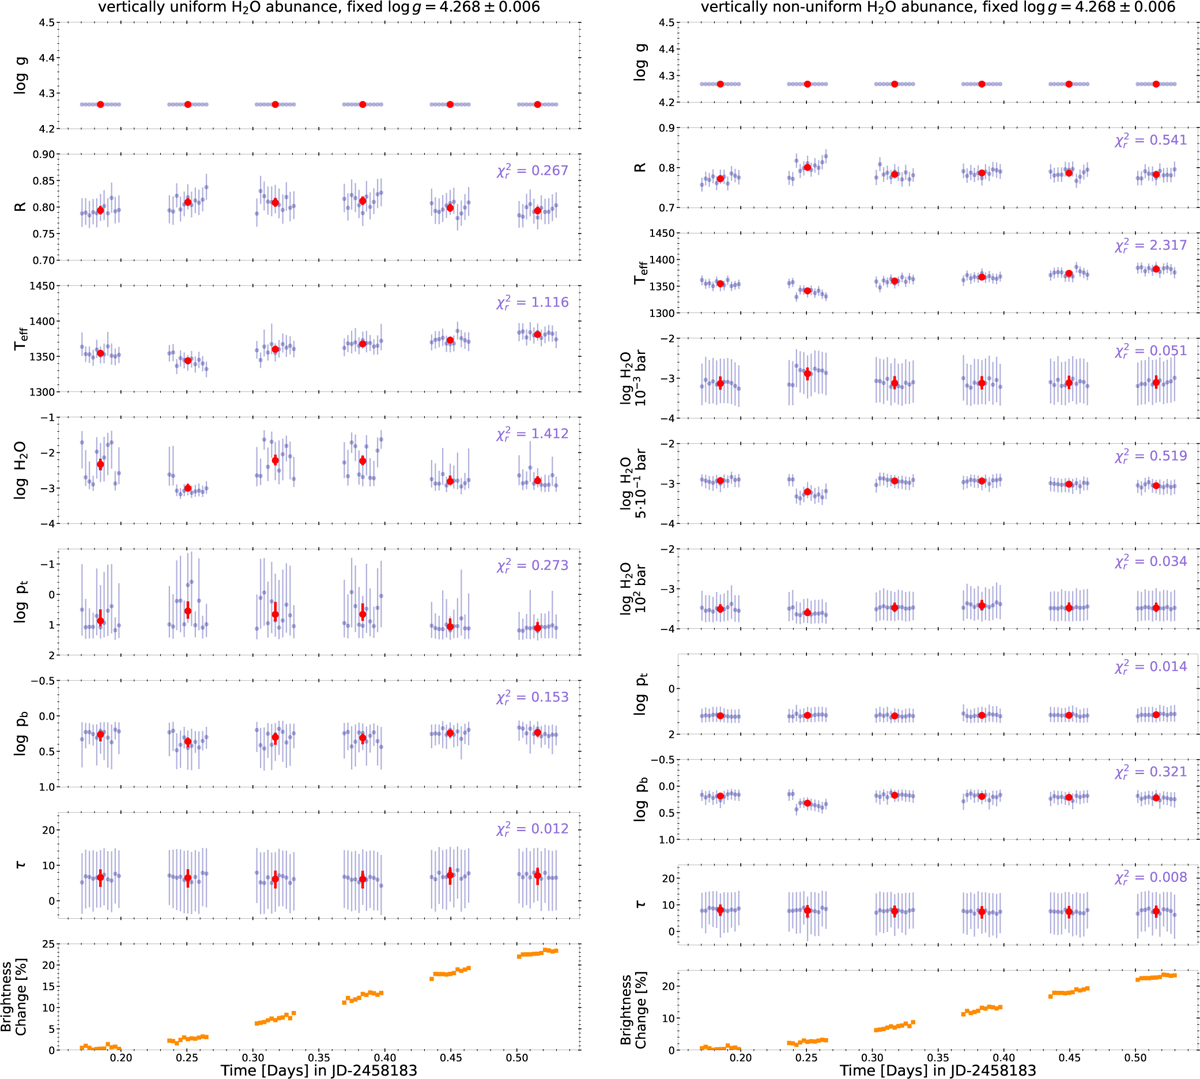
HST18 BeAR posteriors with a fixed surface gravity of log 𝑔 = 4.268 ± 0.006 and vertically uniform (left column) versus non-uniform (right column) H2O abundances as a sequence over all 6 orbits in 2018. Each orbit consist of 11 intra-orbit spectra. Orbit-averaged posteriors are shown in red. The reduced chi-square values correspond to a fit of a straight line through all posteriors of a given parameter. The lowest panel represents the brightness change in G141 broad band, normalized by 3.0 × 10⁻¹³ erg/s/cm2/µm (data taken from Bowler et al. 2020 and Zhou et al. 2022).
Current usage metrics show cumulative count of Article Views (full-text article views including HTML views, PDF and ePub downloads, according to the available data) and Abstracts Views on Vision4Press platform.
Data correspond to usage on the plateform after 2015. The current usage metrics is available 48-96 hours after online publication and is updated daily on week days.
Initial download of the metrics may take a while.