Fig. 3
Download original image
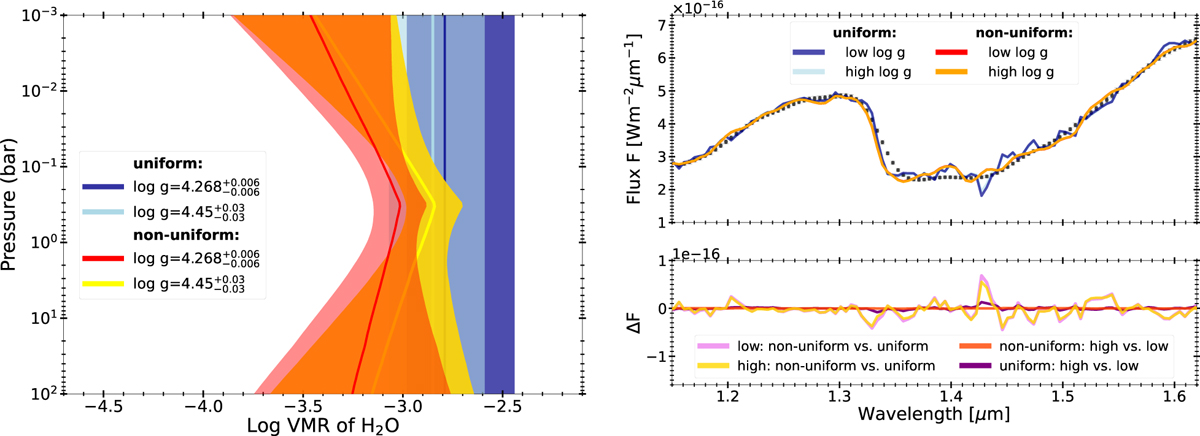
Retrieved volume mixing ratios for H2O of the HST 2018 maximum brightness spectrum (left). Four retrieval runs were conducted: a vertically uniform and a non-uniform H2O abundance profile one for each of the two fixed surface gravity values of log g = 4.268 ± 0.006 (low) and log g = 4.45 ± 0.03 (high). Right panel shows the corresponding posterior median spectra (F) for all four runs and differences between them (∆F). The HST 2018 maximum brightness spectrum data is shown as black dots with associated uncertainties.
Current usage metrics show cumulative count of Article Views (full-text article views including HTML views, PDF and ePub downloads, according to the available data) and Abstracts Views on Vision4Press platform.
Data correspond to usage on the plateform after 2015. The current usage metrics is available 48-96 hours after online publication and is updated daily on week days.
Initial download of the metrics may take a while.