Fig. 10
Download original image
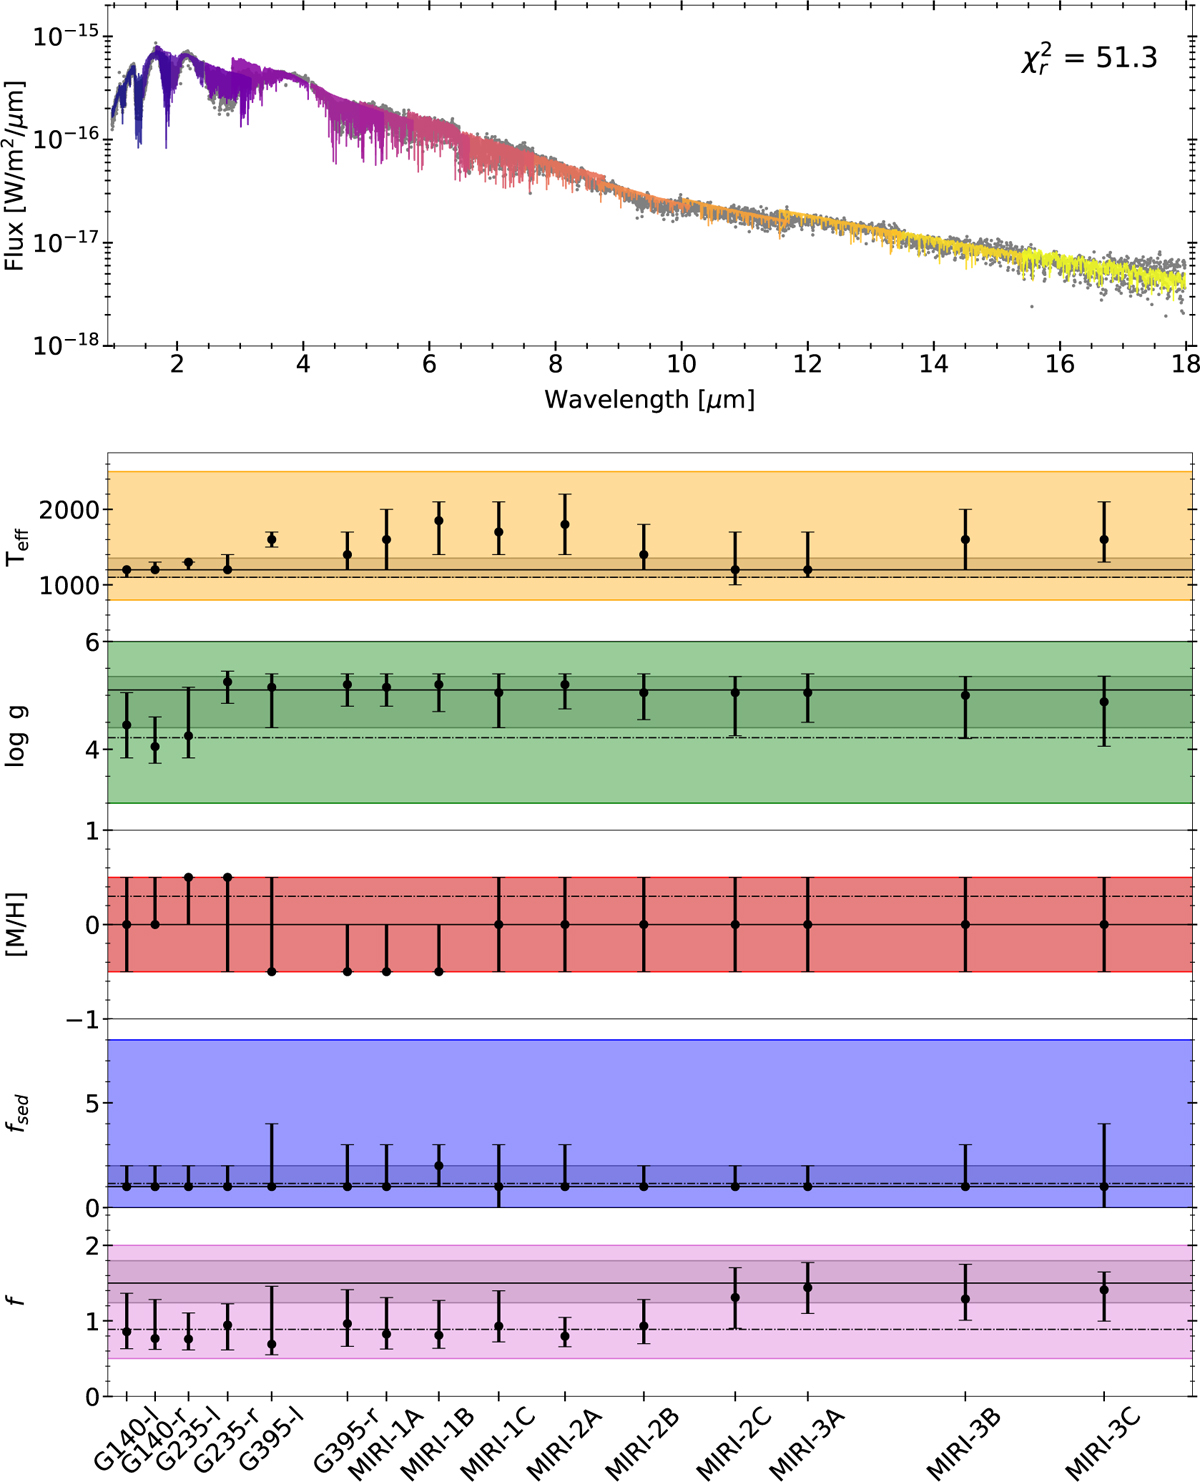
JWST spectra of VHS 1256 b (dark gray dots), overlaid by the Sonora Diamondback (Morley et al. 2024) best fit model spectra for each of the 15 independent spectral windows. Corresponding posteriors for effective temperature, Teff, surface gravity, log g, metallicity, [M/H], cloud parameter, fsed , and scaling factor, f , are presented in the five lower panels, where the parameter range of the grid itself is indicated by the colored area. The posterior values and corresponding errors when using the entire spectrum are shown by the gray line and shaded gray area, respectively. Dashed lines represent the corresponding averaged values from the machine learning retrievals with HST data (see Figs. 5 and 6).
Current usage metrics show cumulative count of Article Views (full-text article views including HTML views, PDF and ePub downloads, according to the available data) and Abstracts Views on Vision4Press platform.
Data correspond to usage on the plateform after 2015. The current usage metrics is available 48-96 hours after online publication and is updated daily on week days.
Initial download of the metrics may take a while.