Open Access
Fig. 1
Download original image
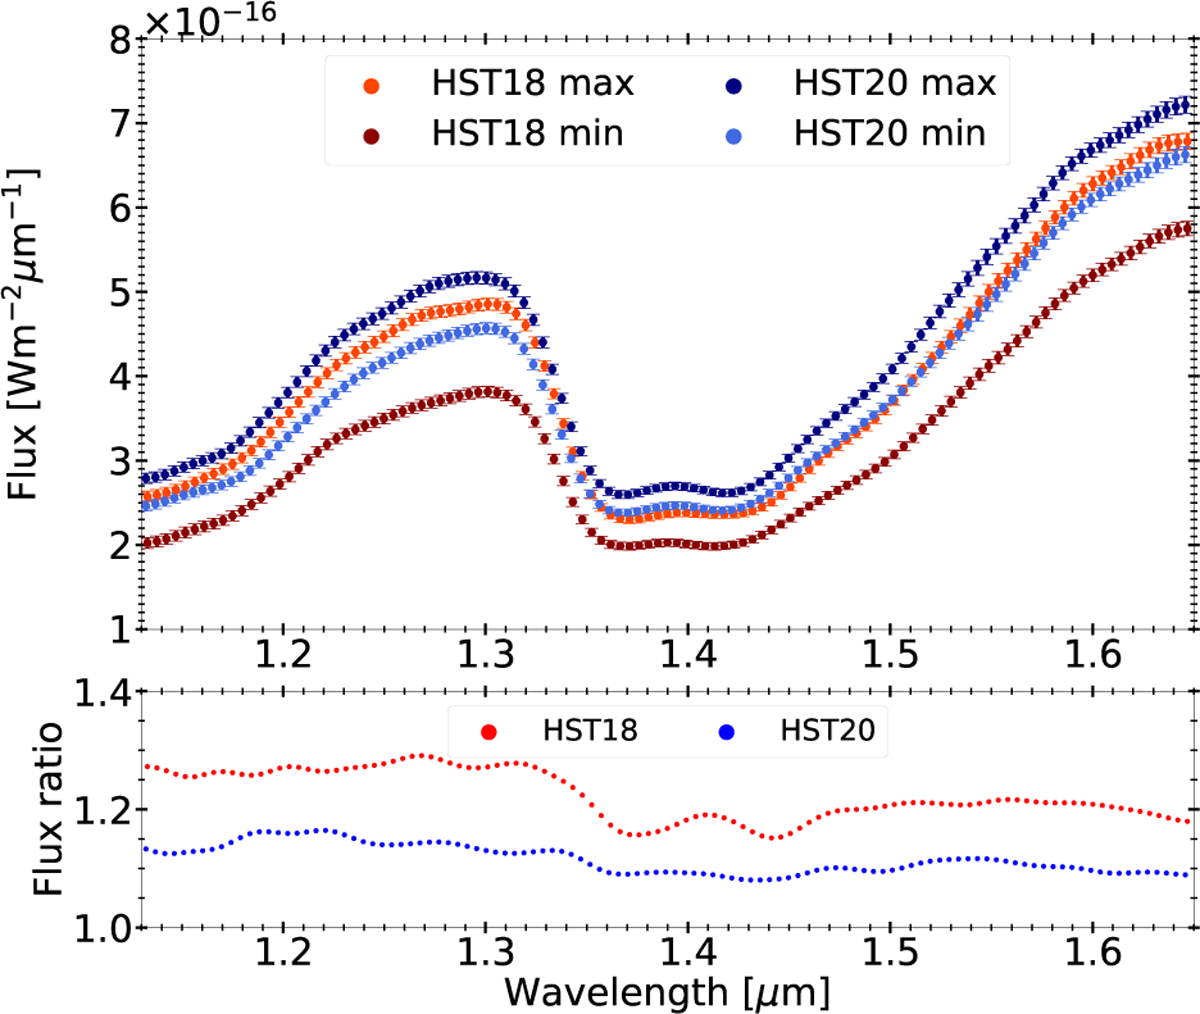
Minimum and maximum fluxes from the two epochs of HST observations of VHS 1256 b in 2018 and 2020. The data were first published by Bowler et al. (2020) and Zhou et al. (2022), displayed here for illustration.
Current usage metrics show cumulative count of Article Views (full-text article views including HTML views, PDF and ePub downloads, according to the available data) and Abstracts Views on Vision4Press platform.
Data correspond to usage on the plateform after 2015. The current usage metrics is available 48-96 hours after online publication and is updated daily on week days.
Initial download of the metrics may take a while.