Fig. 9
Download original image
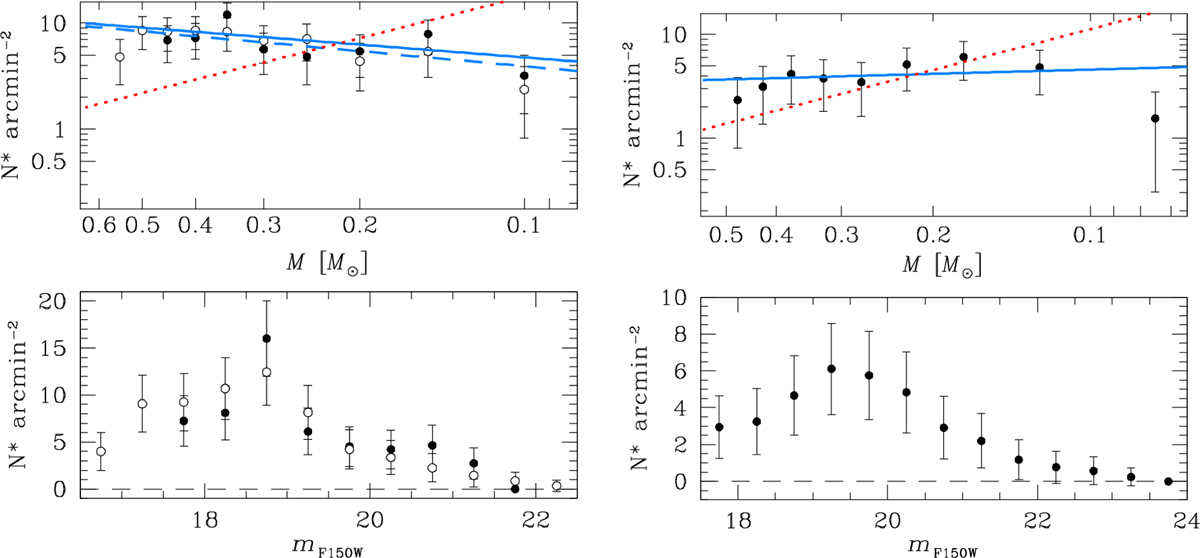
Present-day local LFs (bottom panels) and MFs (top panels) for NGC 6121 (left column) and NGC 6397 (right column). Error bars represent the propagated Poisson errors. The horizontal, dashed line in the bottom panels is set to zero for reference. For NGC 6121, we plot the results for the Northern and Southern fields with open and filled dots, respectively. In the top panels, the blue lines represent straight-line fits to the points, the slopes of which are reported in the text. For the case of NGC 6121, the blue solid line refers to the Northern field, while the dashed line is obtained from the Southern-field points. Finally, the red, dotted lines have a slope of −1.3 (i.e., that of a Kroupa MF in the observed mass range) and arbitrary intercept to fit in the plot.
Current usage metrics show cumulative count of Article Views (full-text article views including HTML views, PDF and ePub downloads, according to the available data) and Abstracts Views on Vision4Press platform.
Data correspond to usage on the plateform after 2015. The current usage metrics is available 48-96 hours after online publication and is updated daily on week days.
Initial download of the metrics may take a while.