Fig. 5
Download original image
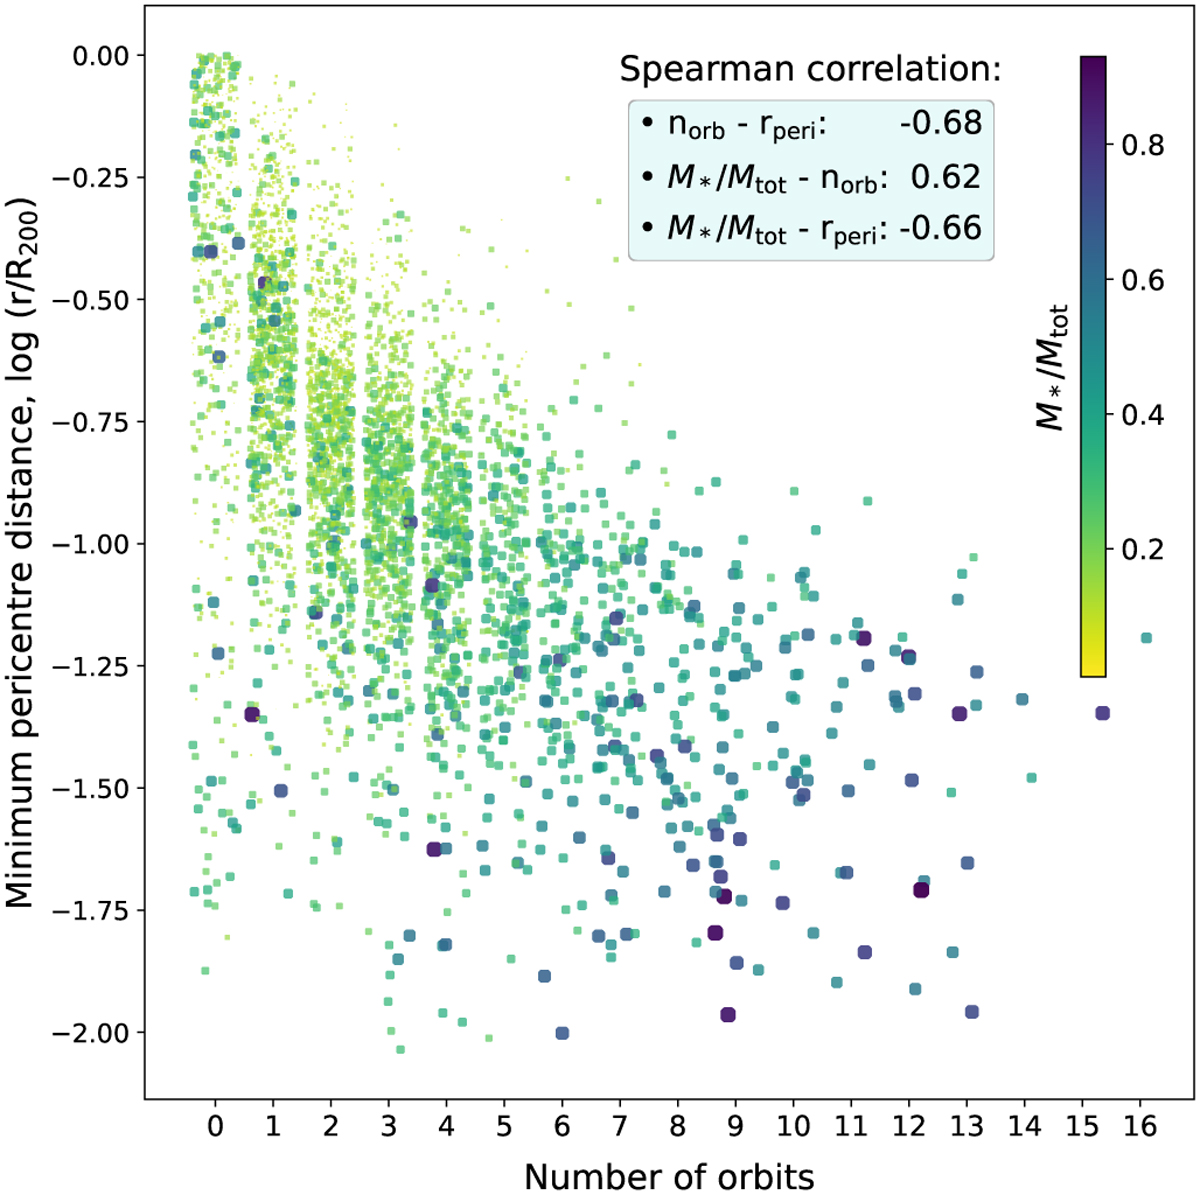
Minimum pericentre distance (in units of R200 of the cluster) as a function of the number of orbits performed by each galaxy, for the sample of massive satellite galaxies. The colours (and size) indicate the stellar-to-total mass ratio, as seen in the central colourbar, with darker (and larger) dots depicting galaxies with a higher value of M*/Mtot, i.e., with less DM.
Current usage metrics show cumulative count of Article Views (full-text article views including HTML views, PDF and ePub downloads, according to the available data) and Abstracts Views on Vision4Press platform.
Data correspond to usage on the plateform after 2015. The current usage metrics is available 48-96 hours after online publication and is updated daily on week days.
Initial download of the metrics may take a while.