Fig. 4

Download original image
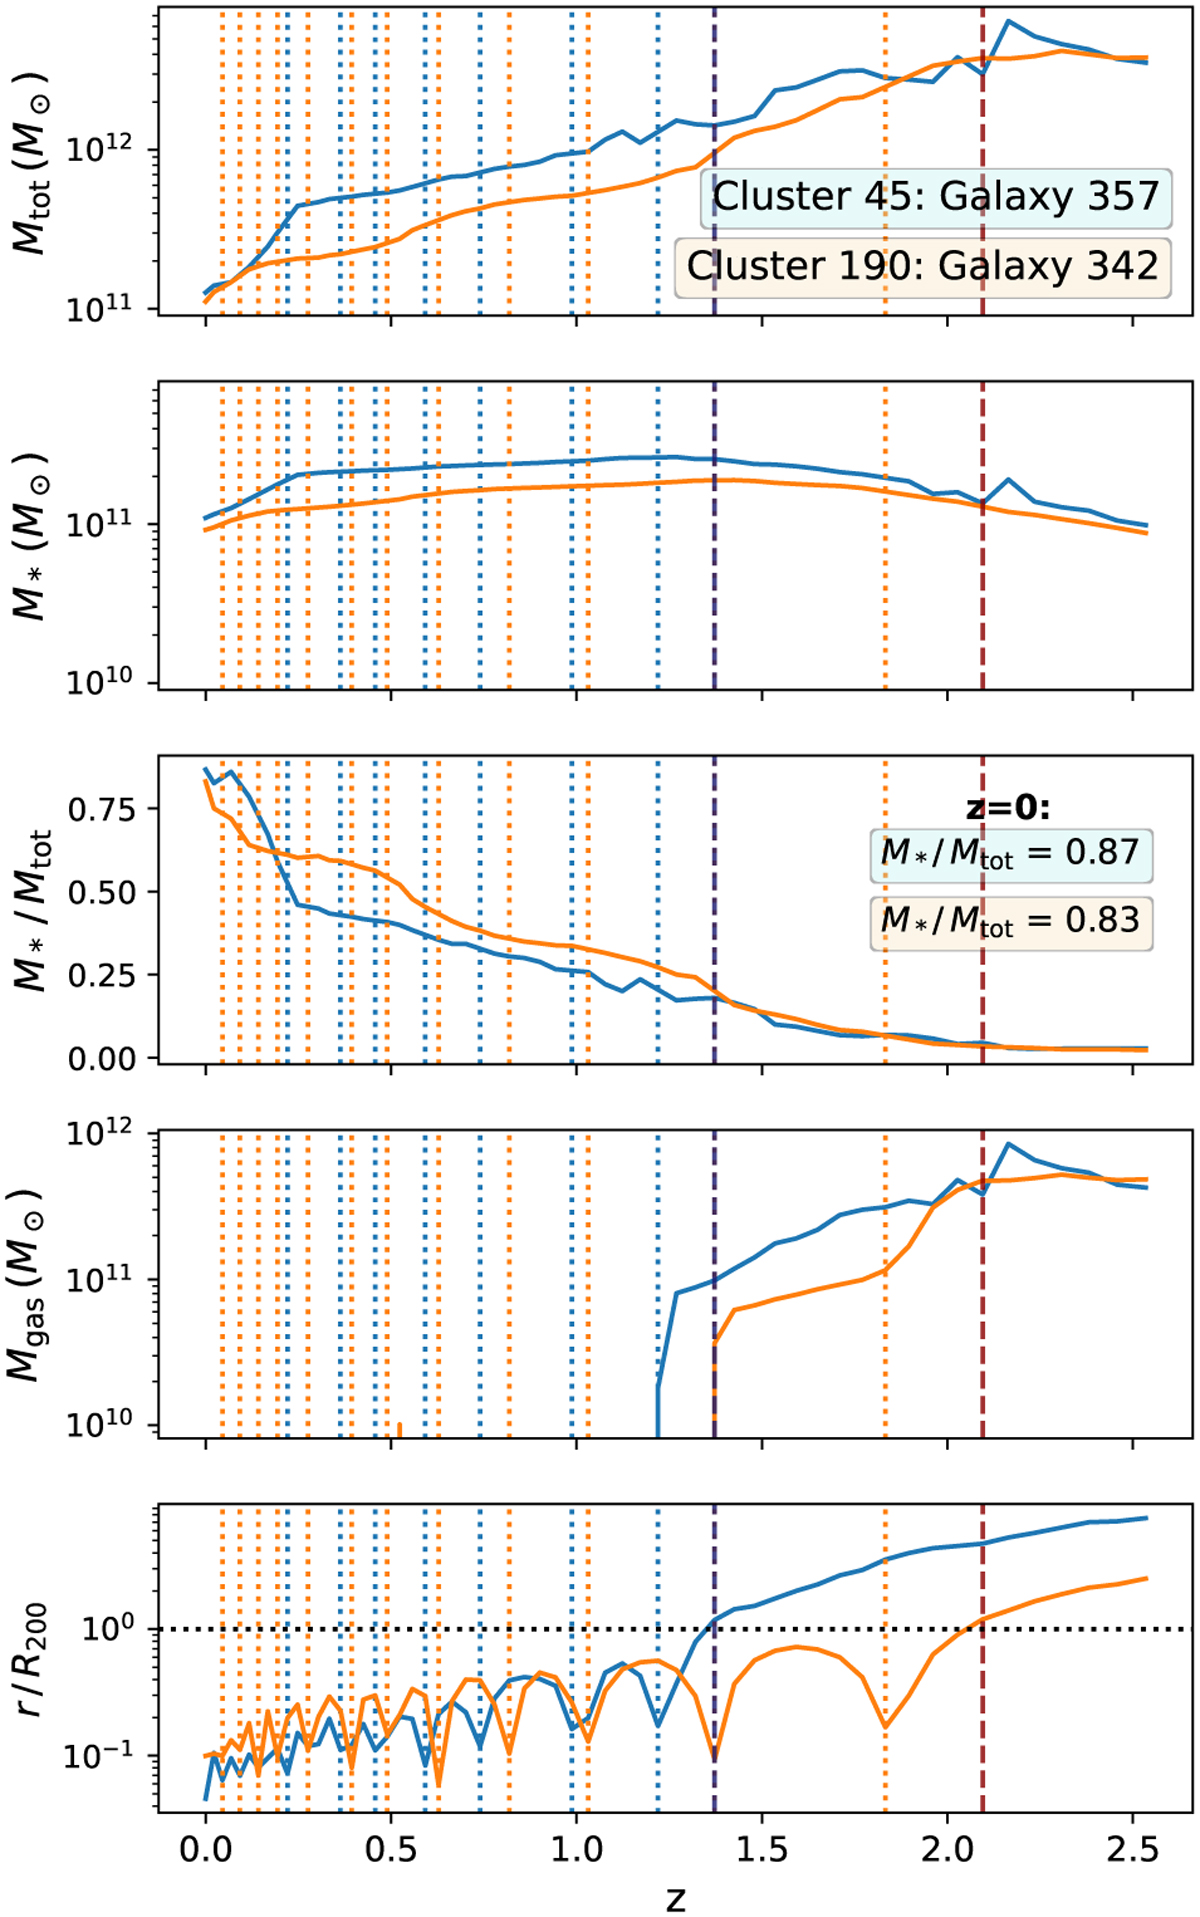
For the two objects previously selected as examples (Figs. 2 and 3), we display the evolution with redshift of five different quantities. From top to bottom, total mass Mtot, stellar mass M*, stellar-to-total mass ratio M*/Mtot, gas mass Mgas and distance to cluster centre in units of cluster radius, r/R200 . The vertical blue and orange dotted lines indicate minima in the distance to centre after infall, i.e. pericentres of the orbit, which can be seen correspond to minima in Mtot and maxima in M*/Mtot. The stellar mass and stellar-to-total mass ratio of the object at z = 0 are indicated in the fourth panel. The horizontal dotted line in the bottom panel indicates the distance r = R200, i.e., pointing to the infall to the cluster. The infall redshift of both objects is indicated in each plot with a dark vertical dashed line.
Current usage metrics show cumulative count of Article Views (full-text article views including HTML views, PDF and ePub downloads, according to the available data) and Abstracts Views on Vision4Press platform.
Data correspond to usage on the plateform after 2015. The current usage metrics is available 48-96 hours after online publication and is updated daily on week days.
Initial download of the metrics may take a while.


