Fig. 2
Download original image
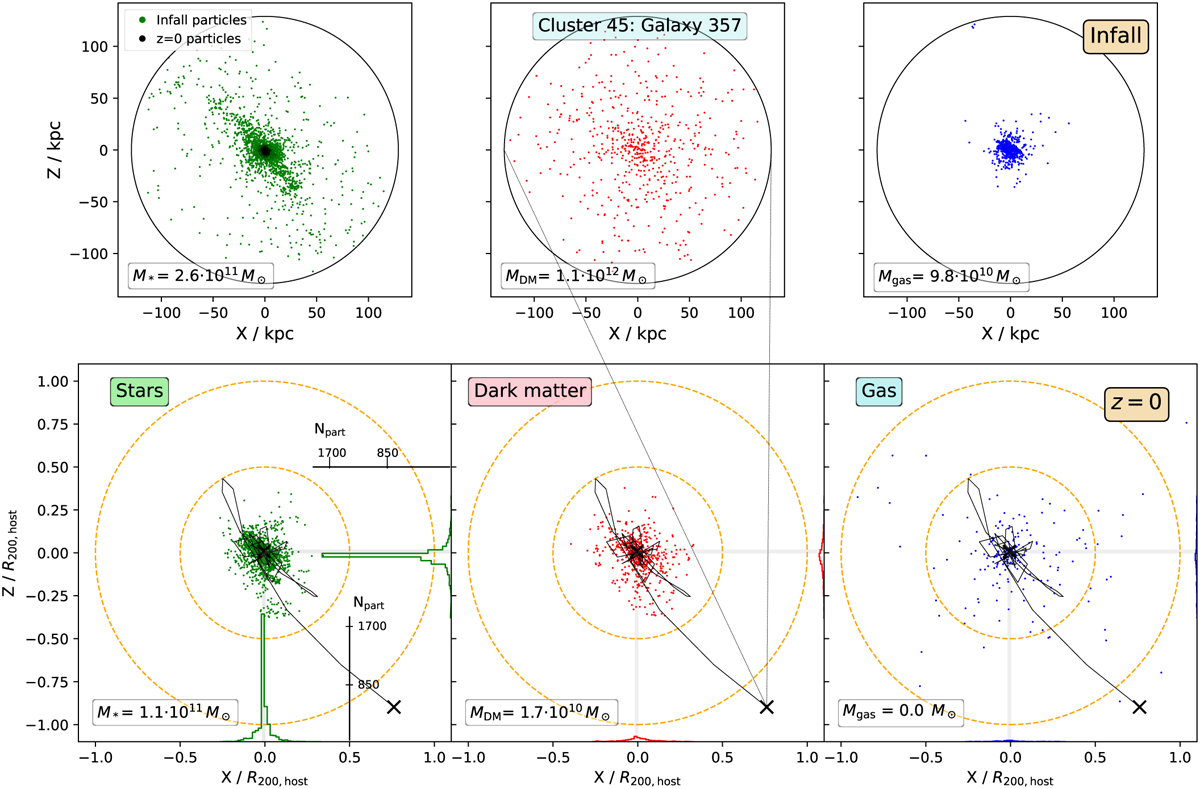
For one of the most massive and dark matter-deficient galaxies, we display in the first row the galaxy at infall, separating into, from left to right, stellar (green), dark matter (red), and gas (blue) particles. The coloured particles are the ones that belong to the object at infall time, while in black we mark those that also end up belonging to the object at z = 0. In the second row we show the final position of all the particles above, now in units of the host halo radius R200. The histograms in the bottom and right axes of each plot show the distribution of the positions of the particles, where the shaded grey regions correspond to the radius of the galaxy at z = 0. The trajectory of the galaxy from infall until z = 0 is shown as a black solid line. The two circles correspond to the host radius R200 at z = 0 (outer circle) and 0.5⋅R200 (inner circle).
Current usage metrics show cumulative count of Article Views (full-text article views including HTML views, PDF and ePub downloads, according to the available data) and Abstracts Views on Vision4Press platform.
Data correspond to usage on the plateform after 2015. The current usage metrics is available 48-96 hours after online publication and is updated daily on week days.
Initial download of the metrics may take a while.