Fig. 4
Download original image
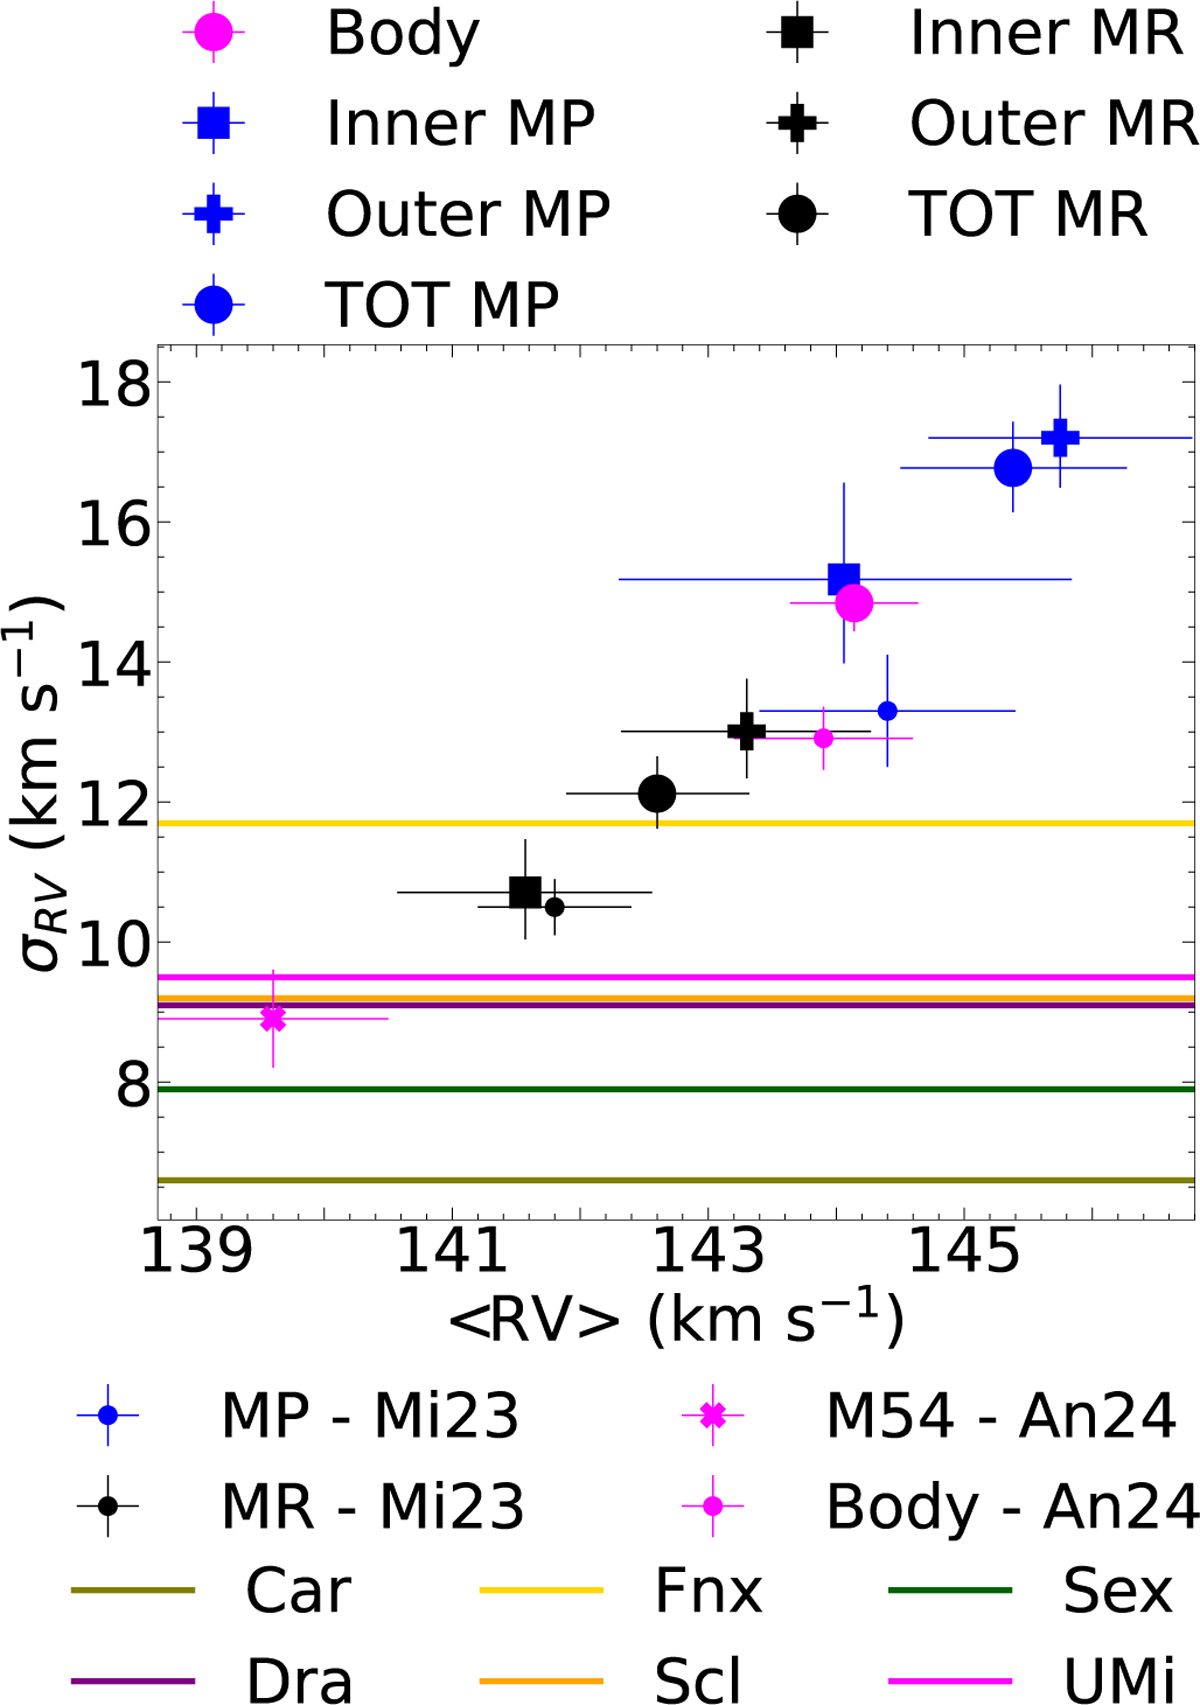
RV dispersion vs. systemic RV. Large blue and black markers denote the metal-poor ([Fe/H] ≤ −1.5, MP) stars from Sgr/AAT and the metal-rich Sgr population ([Fe/H] > −0.6, MR) from APOGEE DR17, respectively. The large magenta circle marks the position of the main Sgr’s body in this space, considering data from APOGEE and Sgr/AAT. Squares, plusses, and circles correspond to the inner (projected distance <0.25rh), the outer (≥0.25rh), and the whole population, respectively. A systematic error of 2 km s−1 is added in quadrature to the RV uncertainties of Sgr/AAT data. The blue and black small circles mark the MP ([Fe/H] ≤ −0.6) and MR ([Fe/H] > −0.6) populations of Sgr from Minelli et al. (2023), respectively. Magenta cross and small circle denote M54 and the main body of Sgr as measured by An et al. (2024). Horizontal solid lines indicate the RV dispersion of the other classical DGs (McConnachie & Venn 2020).
Current usage metrics show cumulative count of Article Views (full-text article views including HTML views, PDF and ePub downloads, according to the available data) and Abstracts Views on Vision4Press platform.
Data correspond to usage on the plateform after 2015. The current usage metrics is available 48-96 hours after online publication and is updated daily on week days.
Initial download of the metrics may take a while.