Fig. 2
Download original image
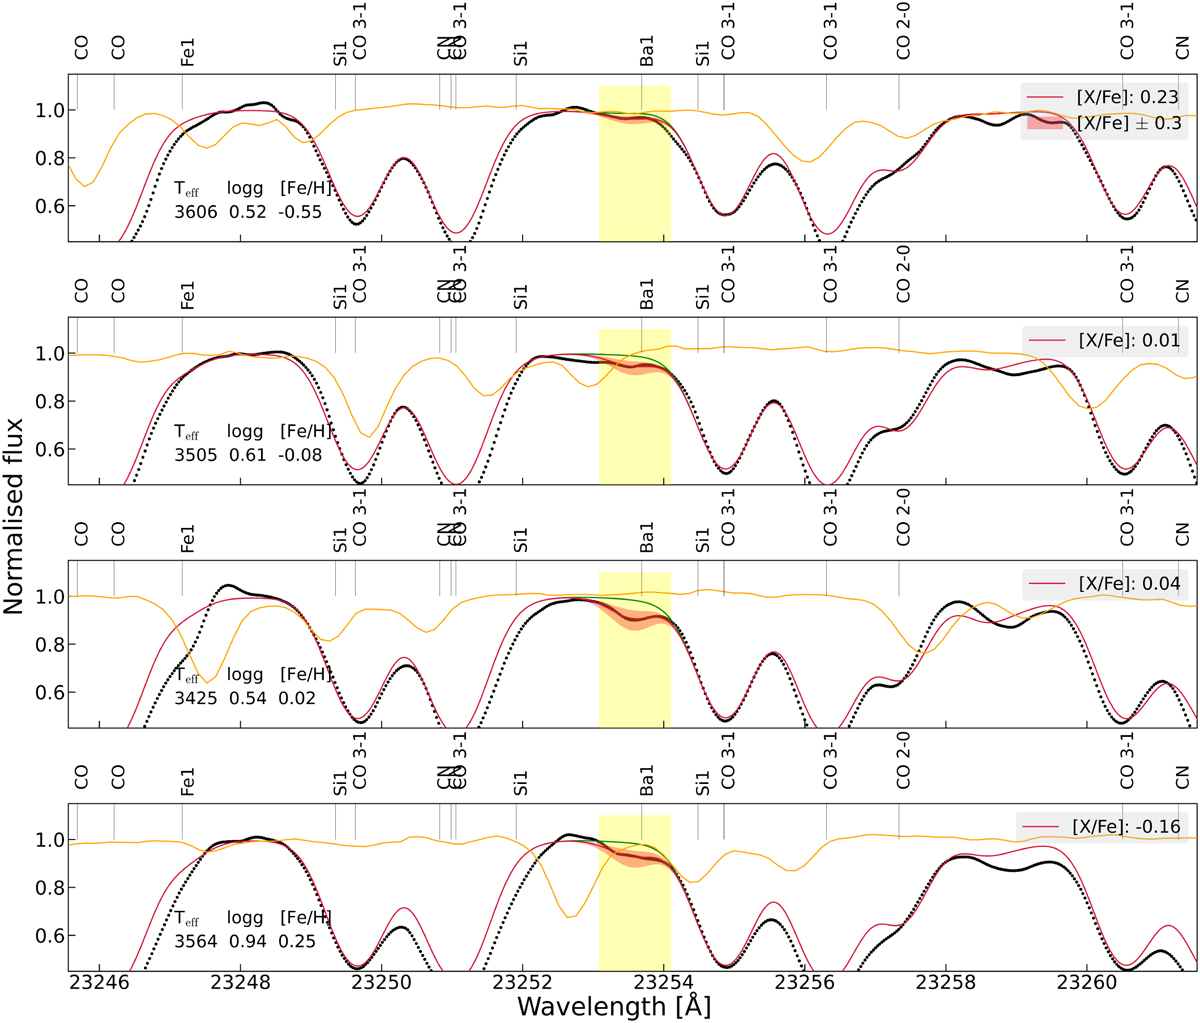
Wavelength regions centred at the barium line at 23 253.56 Å for four stars with Teff ranging from 3400 K to 3600 K and [Fe/H] ranging from −0.5 dex to 0.25 dex. In each panel, the black circles denote the observed spectrum, the crimson line denotes the best-fit synthetic spectrum, and the red band denotes the variation in the synthetic spectrum for a difference of ±0.3 dex in the [Ba/Fe]. The yellow bands in each panel represent the line masks defined for the Ba line. The green line shows the synthetic spectrum without Ba, and the orange line shows the telluric spectrum of the standard star that is used to correct for telluric contamination in the observed star spectrum. The [Ba/Fe] value corresponding to the best-fit case for the Ba line is listed in each panel. All identified atomic and molecular lines are also denoted at the top of each panel.
Current usage metrics show cumulative count of Article Views (full-text article views including HTML views, PDF and ePub downloads, according to the available data) and Abstracts Views on Vision4Press platform.
Data correspond to usage on the plateform after 2015. The current usage metrics is available 48-96 hours after online publication and is updated daily on week days.
Initial download of the metrics may take a while.