Fig. 1
Download original image
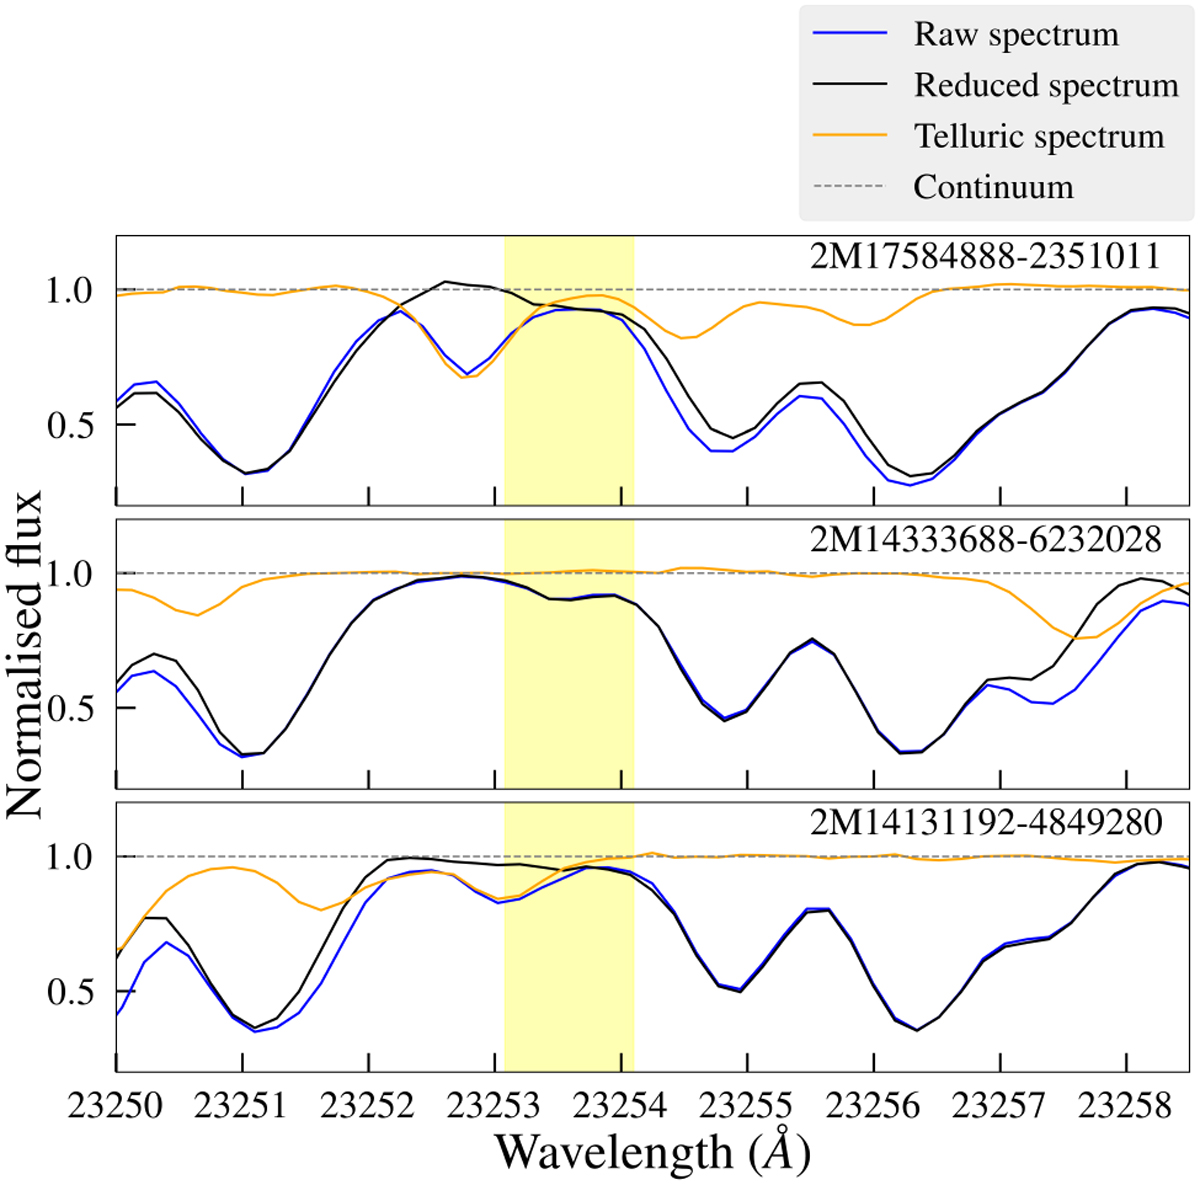
Example spectra surrounding the barium line (yellow band) of three stars, showing the telluric correction carried out in this work. The raw observed target spectrum before telluric correction is shown in blue, the telluric corrected reduced spectrum in black, and the telluric star spectrum in orange. The dashed grey line represents the normalised continuum level at 1.
Current usage metrics show cumulative count of Article Views (full-text article views including HTML views, PDF and ePub downloads, according to the available data) and Abstracts Views on Vision4Press platform.
Data correspond to usage on the plateform after 2015. The current usage metrics is available 48-96 hours after online publication and is updated daily on week days.
Initial download of the metrics may take a while.