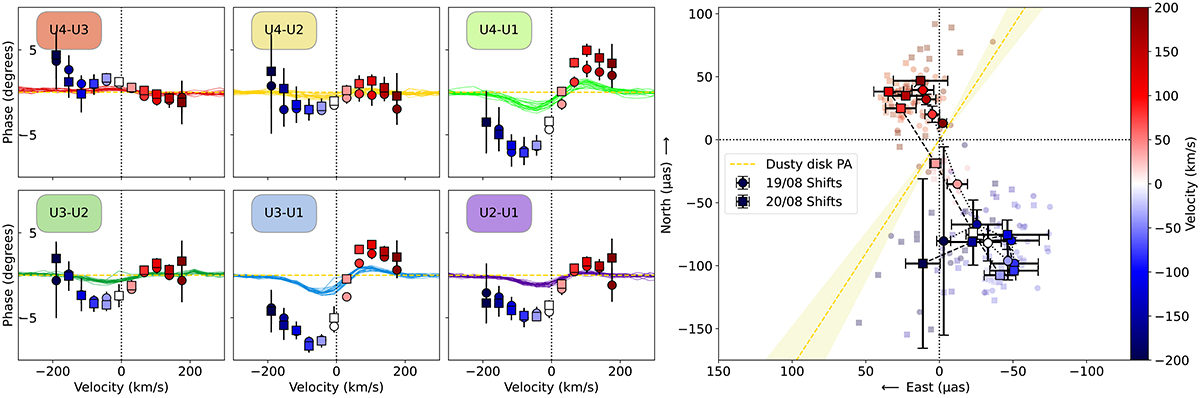
Fig. 3.
Download original image
Asymmetry of the Brγ-emitting region of S CrA N. Left : Pure-line differential phases. The pure line differential phases are depicted by blue-to-red color coded symbols for August 19 (circles) and August 20 (squares), while the observed phases for each individual observation (similar to Fig. 2) are depicted in solid lines, with their color corresponding to their baseline. Right : On-sky photocenter shifts with respect to the continuum photocenter (in (0, 0) as a function of velocity (coded from blue to red colors). The light-yellow cones correspond to the uncertainties on the major axis orientation of the inner dusty disk. The background symbols are the displacements obtained from individual files.
Current usage metrics show cumulative count of Article Views (full-text article views including HTML views, PDF and ePub downloads, according to the available data) and Abstracts Views on Vision4Press platform.
Data correspond to usage on the plateform after 2015. The current usage metrics is available 48-96 hours after online publication and is updated daily on week days.
Initial download of the metrics may take a while.