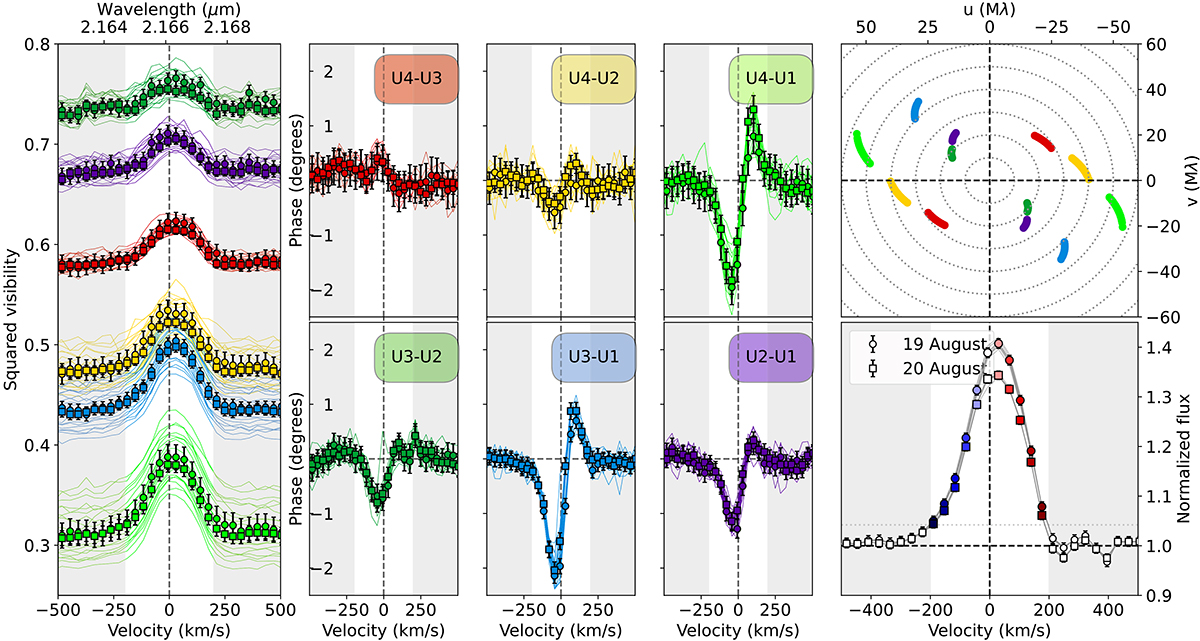
Fig. 2.
Download original image
Brγ differential interferometric observables of S CrA N: Squared differential visibilities (left); differential phases (middle); u-v plane coverage (upper-right); line-to-continuum flux ratio in the reference frame of the star, LSR- and tellurics-corrected (lower-right). Each color used in the u-v coverage plot corresponds to an interferometric baseline and is consistent over all panels. For the interferometric observables, the plots include the quantities for each frame (solid lines) and the median for August 19 (circles) and for August 20 (squares). Uncertainties are given in all plots (vertical bars), and are smaller than the symbol if not visible. Gray shaded regions correspond to the velocities that are not considered for our Brγ line analysis (see text for details).
Current usage metrics show cumulative count of Article Views (full-text article views including HTML views, PDF and ePub downloads, according to the available data) and Abstracts Views on Vision4Press platform.
Data correspond to usage on the plateform after 2015. The current usage metrics is available 48-96 hours after online publication and is updated daily on week days.
Initial download of the metrics may take a while.