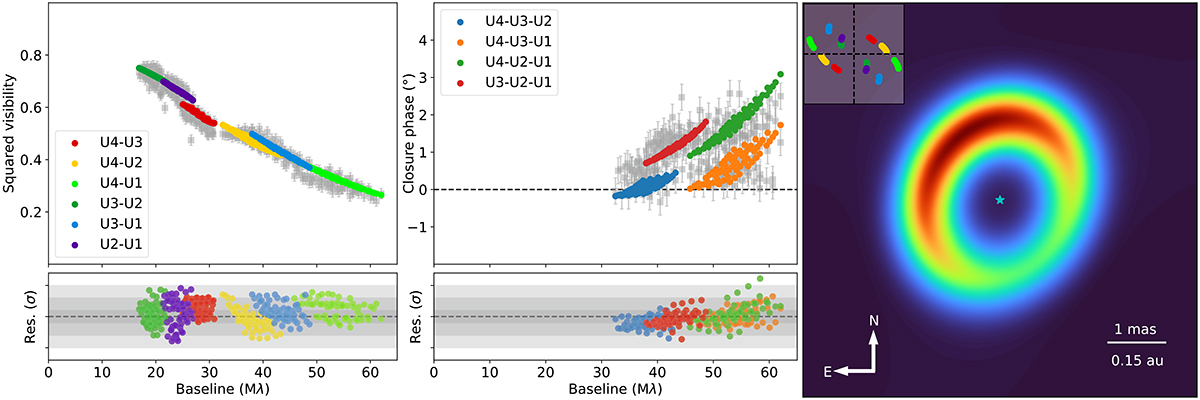
Fig. 1.
Download original image
GRAVITY observations of S CrA N on 2022 August 20: K-band continuum visibilities squared (left) and closure phases (center) as a function of baseline (gray symbols) superimposed with the best-fit ring model (right). The modeled quantities are depicted in colors matching the (u-v) plane coverage shown in the inset on the right. The lower panels show the residuals of the model in units of σ. Shaded bands highlight 1-, 3-, and 5σ levels.
Current usage metrics show cumulative count of Article Views (full-text article views including HTML views, PDF and ePub downloads, according to the available data) and Abstracts Views on Vision4Press platform.
Data correspond to usage on the plateform after 2015. The current usage metrics is available 48-96 hours after online publication and is updated daily on week days.
Initial download of the metrics may take a while.